In spite of all the distractions in the world over the first couple months of 2020, KaiNexus pushes forward and is proud to present our latest 2.4.3 release with 30 new improvements!
Let’s take a look at some of the highlights:
Lists & Filters
Introducing Anticipated Start Date & Anticipated Due Date! This new feature visualizes when planned items are expected to start and end which makes seeing an accurate timeline easier.
Items with a Planned status will be given an Anticipated Start Date and Anticipated Due Date in the system and when changing information as part of dependencies, the Anticipated Start Dates and Anticipated Due Dates on upstream and/or downstream Items will update to align with these changes.
You can use the Anticipated Start Date and Anticipated Due Date as filter options and can also visualize them as columns in List, Tree, or Gantt view.
Reports
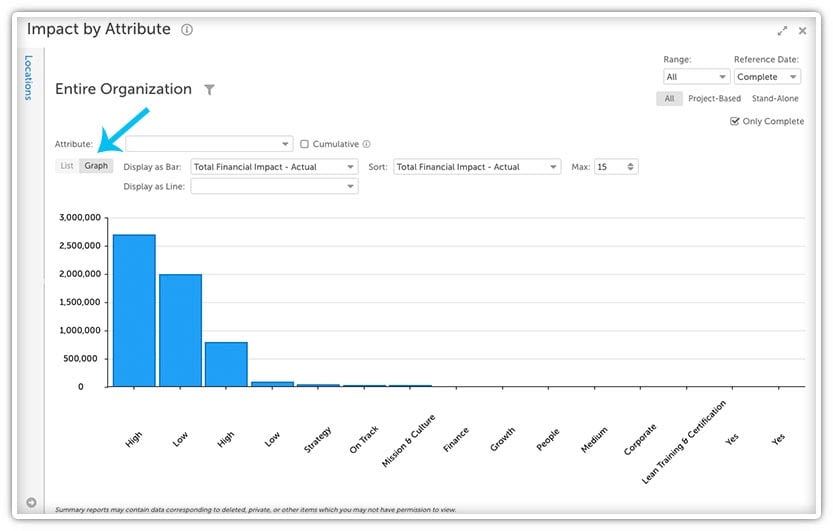
Enhancements have been made to the Impact by Attribute Report! You are now able to run this report by Realized Date and have the option to include the cumulative impact. When viewing the report in graph mode, you can also add multiple line series.
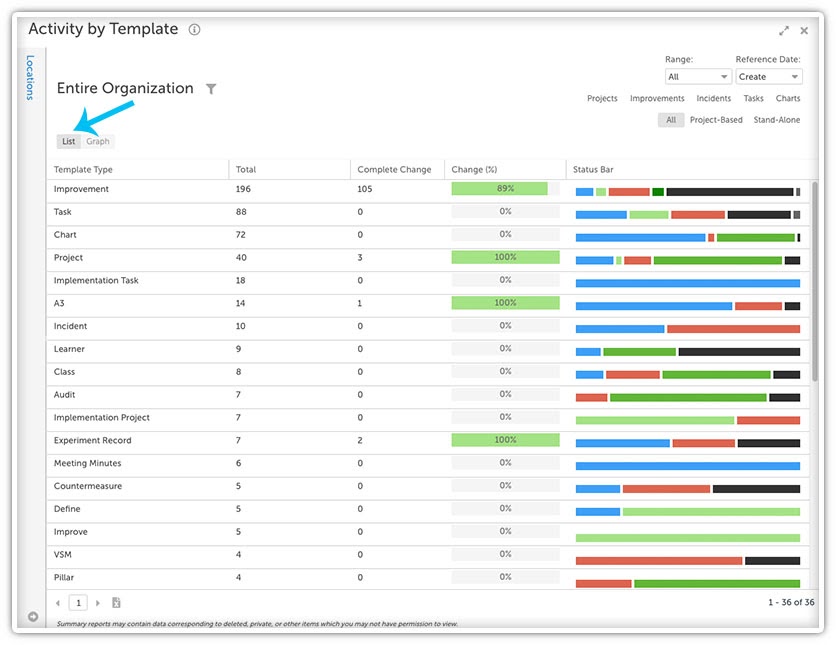
An entirely new report, the Activity by Template Report, has been added to the Activity section of the Reports area! This report allows you to get a birds-eye view of how your Templates are being used in KaiNexus. With this report, you can see which of your Templates are being used, how many Items of that Template Type are in the system, and what status those Items are in.
Charts
More customization options have been added to Charts. You can now customize the bar width, spacing, layering, and opacity in the Bar Settings of Charts to fit your unique needs.
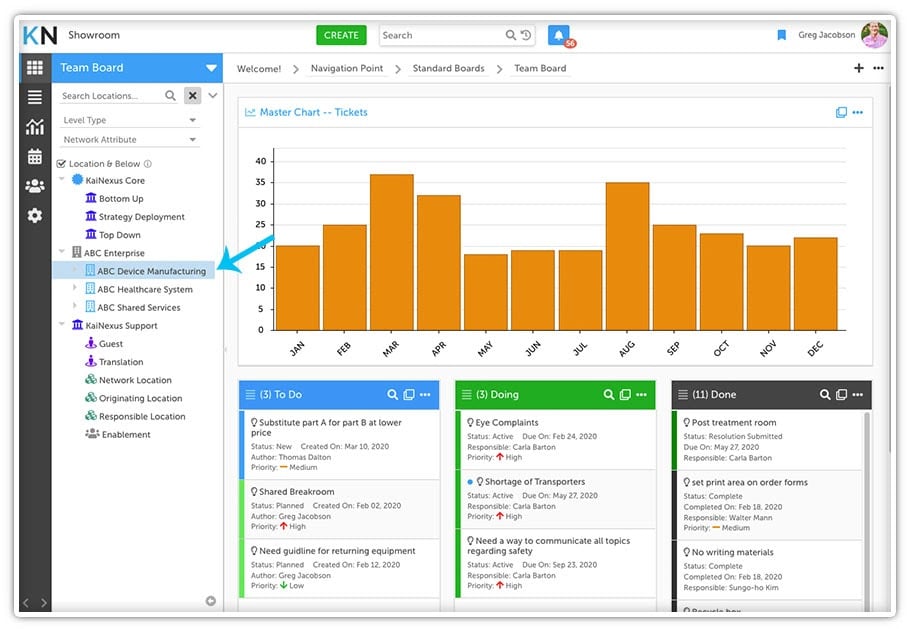
While on a Board with a Chart Card using Shared Series, you can now use the location filter to display and filter data from multiple locations on a single chart using the Filter Data Series by Location functionality.
AdHoc
New functionality has been added to AdHoc Fields! You now can show total and/or show the average for your AdHoc Number Columns. Also, tooltips can be added to the AdHoc Text and Number Field Columns.
Standard Work
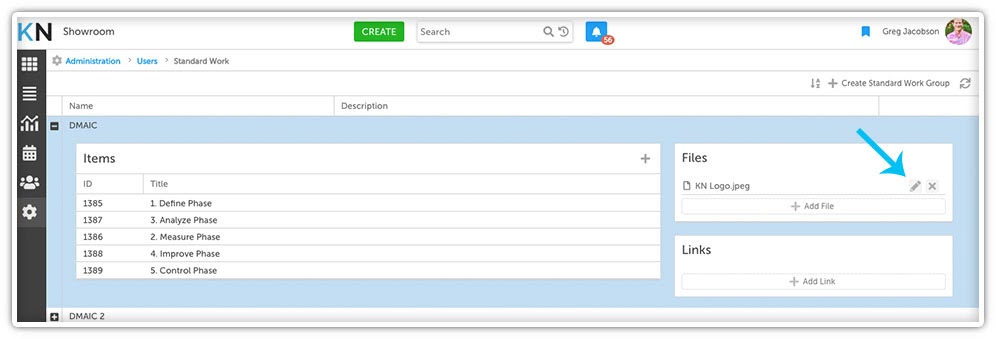
Standard Work has new functionality! You can now add hyperlinks and display images on Standard Work groups. Images added as files to Standard Work will allow you to check a "Show in Image area" box to ensure that it appears in the images panel when adding the Standard Work group.
If you’re interested in what you saw today and want to learn more, be sure to sign up for our next Training Team Office Hours Webinar on March 12th where we will take a deeper dive into the 2.4.3 release. To check out all our webinars over this past year, head over to kainexus.com/webinars/office-hours.
In the meantime, if you have any questions or need assistance with the configuration of these features, please reach out to your KaiNexus customer experience representative. Also, we definitely encourage you to check out the 2.4.3 Release support page at support.kainexus.com.


.svg)


Add a Comment