Any leader of continuous improvement knows that it's difficult to prove the effectiveness of the work you're doing. A lot of the benefit of your work is soft and indirect, and it's a struggle to really know how you're performing. However, I would assert that one can determine the health of an improvement culture - and subsequently the success (or not) of efforts to spread such a culture - quantifiably by looking at metrics around three key categories: activity, engagement, and impact.
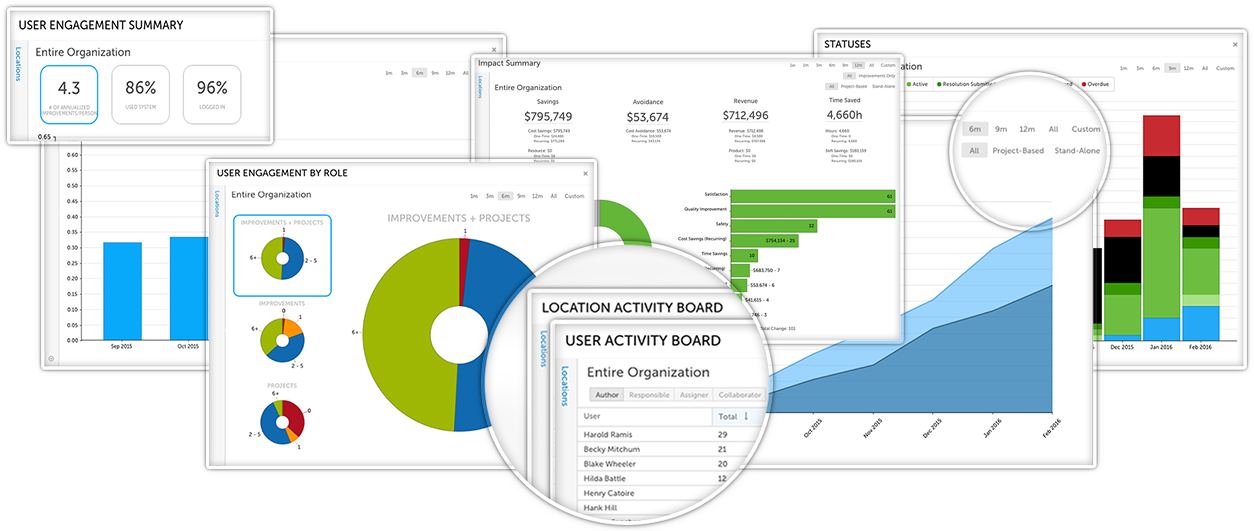
In this article, I'm going to detail the types of information are relevant in this type of evaluation. The included screenshots and reports are pulled from the KaiNexus improvement platform - but however you can gather and report on this data is fine for evaluating your culture. To learn more about KaiNexus and reporting in particular, check out this free webinar -
ACTIVITY
The first area you'll want to look at when evaluating the health of your culture is activity around improvement in your organization.
Questions you might ask include:
- What kind of improvement work are people doing?
- What are the statuses of their projects?
- Is work completed on time?
- How's the distribution of improvement labor?
Who is working on what?
You need a detailed view of the activity of individual people, teams, and locations throughout the organization so that you get a snapshot view of who's busy improving, who may be overloaded, who needs guidance on delegating, and the rate of improvement. These are all critical elements for leaders to understand improvement activity in your organization.
What's your improvement cycle time?
This report should break down the progression of initiatives through the improvement cycle so that you can see how long it takes to get ideas through from conception to completion. You need to be able to tell where improvements are getting stuck and where additional resources might be necessary, and identify opportunities for coaching to reduce that cycle time. Remember - every day that an improvement languishes in the system is a day that it isn't driving an impact.
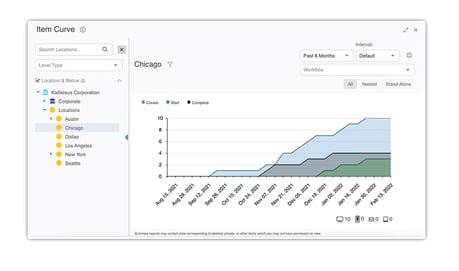
How is your improvement curve?
The improvement curve is one of my favorite reports in KaiNexus. It shows the number of improvements submitted into the system in relation to those implemented. This analysis allows you to identify trends (both positive and negative) and act quickly to improve the health of your improvement culture. Things to watch for here include a drop in the rate of idea submission, a divergence between the lines indicating that improvements are being implemented too slowly, and whether your organization is tracking to the goal you've identified.
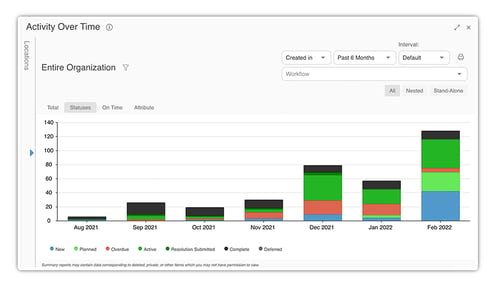
Statuses
This one is pretty straightforward - you need to be able to see the number of improvements at each stage of the improvement cycle in a simple report that enables you to drill down into the details of any particular time, status, or location. This takes the guesswork out of evaluating progress and gives you all the details you need to allocate praise and coaching appropriately.
ENGAGEMENT
To understand the engagement of people in your improvement culture, you need to be able to drill down into some pretty nitty-gritty details. Look at each location in the organization to see what percentage of people have logged into your improvement management system, how many ideas they've submitted, and their annualized rate of improvement.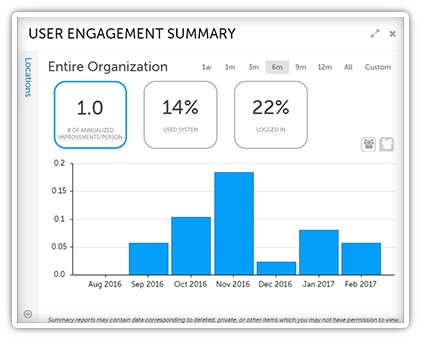
We know that 80% of any organization's improvement potential is in the front lines; these are the people who are actively doing the work of the company, and thus they are in the best position to improve that work with small, incremental changes. The more you can get people to engage in organized, intentional, daily improvement, the more robust your improvement culture will be.
IMPACT
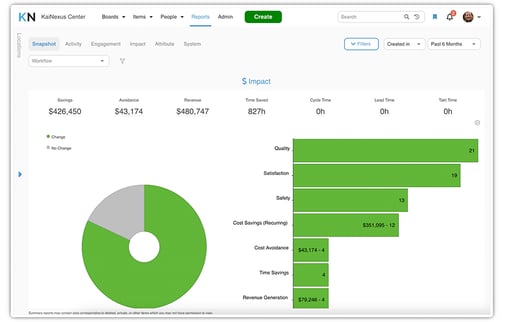 Understanding the impact of your improvement efforts is critical to evaluating the health of your improvement culture.
Questions to ask might include
- What's the impact of improvement in terms of cost savings, revenue generation, and time savings?
- What's the more qualitative effect of improvements, such as quality, staff and customer satisfaction, and safety?
- What percentage of ideas actually result in change?
Notice that you don't only want to focus on the quantitative aspects of improvement like financials. To increase engagement and get more people to care about the improvement work, you need to prioritize the qualitative, feel-good elements as well. It's common for a new improvement culture to see staff focusing primarily on improving their satisfaction, the happiness of their customers and the quality of service they provide to them, the safety of themselves and their patients, etc. People FEEL these benefits more directly in their daily work, making them appealing as you ramp up enthusiasm for improvement. Of course, lower staff turnover, fewer accidents and injuries, happier customers, etc. all play into the bottom-line of any business, making improvement a win-win regardless of where your people focus their energies.
So, there you have it - three areas to focus on if your goal is to increase the spread of your improvement culture. Which metrics have been a good indicator for the health of YOUR improvement culture? Leave a comment below to tell us about it.


Add a Comment