When used correctly, data can help an organization in their improvement process, guiding and shaping each step to make sure no resources are wasted. However when not used correctly, or when collected but not used at all, data can become a drain on those already limited resources.
We recently held a webinar, which you can watch here, to help those undertaking continuous improvement processes understand how to manage improvement metrics more efficiently and effectively.

The webinar was hosted by Jeff Roussel, our VP of Sales, and our VP of Improvement & Innovation Services, Mark Graban. Graban not only works with KaiNexus, but he is also the author of several books including Lean Hospitals - and is the founder of the popular blog LeanBlog.org. With all that experience to share, Graban dug right in with a book recommendation. The book, Understanding Variation: The Key to Managing Chaos by Donald J. Wheeler, PhD., is a tool Graban has used often over the past 15 years that delves deeper into the topics covered in the webinar.
Getting into the core of the webinar, Graban explained that though he is able to show off some of the performance tracking charts KaiNexus automatically produces as his examples, the tips he's sharing in the webinar are going to be helpful and implementable - no matter what continuous improvement tools you are using.
“Whether you’re doing this on paper, in excel, in some sort of statistical software, or KaiNexus, these same principles I’m going to talk about today apply,” Graban said. “Because again it all really comes back to this question: are we improving?”
The Need to Avoid Bad Conclusions
The first lesson Graban hit on, which comes from the author mentioned earlier Donald J. Wheeler and others, is the idea that we need to draw the right conclusions from the charts and data.
Graban first showed how “Bowling Charts” offer slow results and vague conclusions. Dense tables of numbers are hard to read for many, as people are very visual creatures. Using various examples of real data and charts, Graban also showed how using only a few data points, cherry-picking data, or relying on Microsoft Excel trendlines can lead to completely different conclusions on easier-to-read charts.
“How do we respond as managers? Do we end up wasting a lot of time, or losing opportunities to improve based on what data is actually telling us? Are we drawing the wrong conclusions sometimes in our attempts to answer this question; are we improving?” Graban said. “So how can we tell, if dense tables of numbers, simple comparisons against goals, or even linear trend lines can be misleading? We have other methods that are not much more difficult to use, but are far more accurate and far more effective in helping us draw conclusions about our performance.”
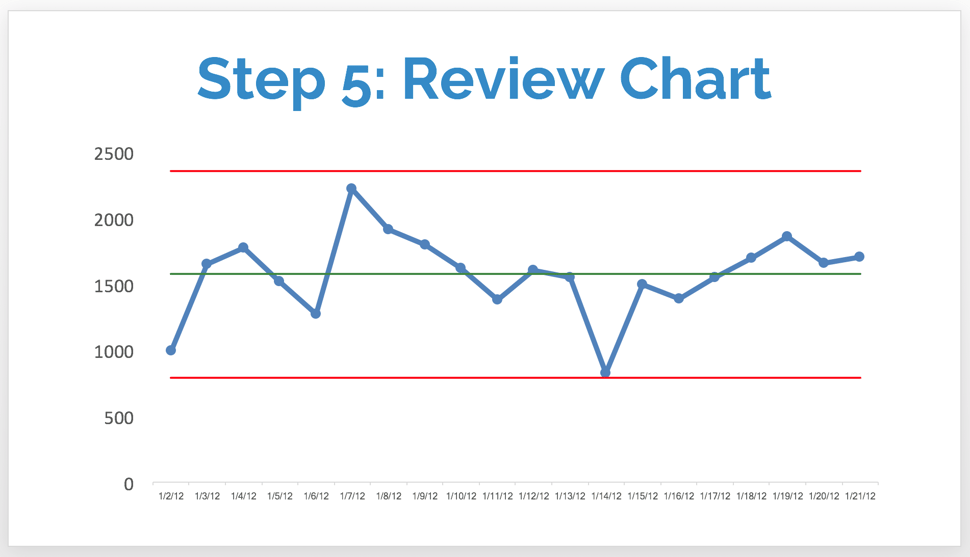
Control Charts
Graban explained the best method for helping us analyze our data is a control chart. While there are a number of different kinds of control charts, the method normally used for performance measures is called the control chart for individuals method. These charts are run charts—a graph that displays data in a time sequence— with an average line, as well as a control limit lines, which are calculated based on the data.
For more information on this topic, Graban has put together a bonus video about how to create these control charts - you can watch it yesterday's blog post.
When looking at a control chart, if the ups and downs of the data fall within the control limits, and roughly half the data points are above, and roughly half are below the mean, you can see that the item being measured is under control, that it’s a process that’s stable and that performance can be predicted. A stable chart like that can also tell you if a goal is achievable under the current system, or if a major system change is needed in order to achieve the goal. A system change might consist of improving the physical layout of the workspace, batching, etc. These charts can also be used to measure the effectiveness of those new systems you're implementing. If you made a change that you expect to improve the system, you can use a control chart to test the hypothesis.
Giving management the tools to know when fluctuations are just “noise” is helpful, as not knowing when changes are just variations can lead to three problems:
- Pressuring people to get better results by working harder within the same system
- Wasting time looking for explanations of a perceived trend when nothing has changed
- Not focusing on systemic improvements that would shift the mean
On the other hand, when a data point all of a sudden falls out of the control limits, management can clearly identify it as a signal to investigate what happened to find out if the system changed or if it was a one-time occurrence that was solved.
When a data point falls out of the control limits in a good way, managers can take this as a signal that it wasn’t just chance - and they can investigate to find out what happened so that the good change can be replicated in the future. Managers can then shift the control limits to reflect the new system, and continue to monitor the noise for any signals.
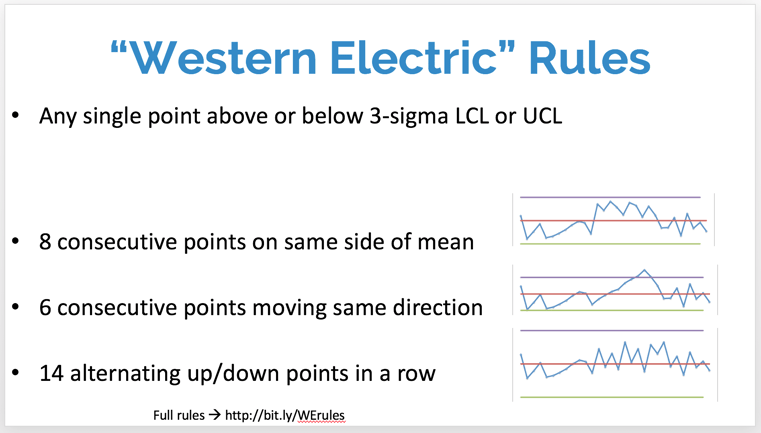
Western Electric Rules
There are tools to help managers identify signals, Graban explained - these are the Western Electric Rules. As Graban explained, the Western Electric Rules are there to help prevent the two types of errors that can be made when looking at this kind of data: missing a signal that’s actually there, or signals that are actually false positives.
Are we hitting our goals?
Graban wrapped up by coming back to the point he made earlier about not focusing on goals, but systems.
“I’m not saying to ignore goals, or that goals aren’t important. But what I’m suggesting is that there are two separate questions here: Are we improving? And, are we hitting our goals?” Graban explained. “What we have to be careful about is, a lot of times in management, we set what are basically arbitrary goals. And those arbitrary goals might not be really meaningful, it may lead to a lot of wild-goose-chase activity within the organization.”
Improve the system
Graban acknowledged that if managers are not supposed to act on the ups and downs that are noise, they may ask if they are supposed to do nothing.
“No, we’re not supposed to do nothing, what we’re supposed to do is improve the system. And when we use statistics – this is not calculus, this is arithmetic—and using our eyes, and using visual charts, not tables of numbers, we can better understand our system; we can look at the voice of the process, and we can do a better job of rallying out team to improve,” Graban said.


.svg)


Add a Comment