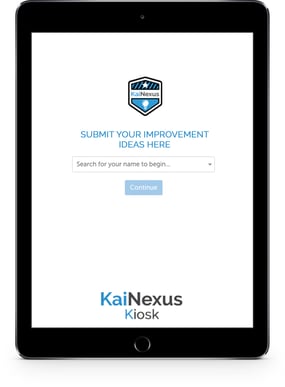
The latest 2.3.0 Release was one of our biggest updates of the year. With 31 new Improvements, there is something for everyone in this version. Here are some of the highlights:
Kiosk Mode
 We’re excited to introduce a new add-on module of KaiNexus which makes it possible for users to easily submit select items from a kiosk without logging into KaiNexus.
This removes technical barriers and allows more people to participate in CI, whether or not they use a computer in their daily work. Users need minimal training, and can quickly submit items without disruption to their tasks.
- Perfect for work environments where employees don’t work at a computer all day long - whether they’re usually on the shop floor or at a shared workstation
- Regular / Advanced users can submit items on the fly to come back to later
- Can be coupled with the Wallboard module to create a KaiNexus station where people can submit items and get an overview of what’s going on in KaiNexus without logging in.
Email/Notification Redesign
We have completely redesigned the look and content of notifications!
By showing more information, we give each notification more context. That enables you to work more efficiently without having to open up every Improvement to see its details.
Chart Annotations
With the new Chart annotations, you can make notes on and link items to specific data points on any of your Charts.
By giving context to your data points in this way, it’s easier to draw parallels between Improvements and KPIs and to tell the story behind the data.

Date Range Visualization on Charts
We know that when Charts start to have lots of data they become harder to read, so we’ve made it possible for you to set the default date ranges shown on your Line, Bar, Threshold, and Bowling Charts.
Chart Status/State Bar
A “Chart Status Bar” column showing the status of all nested Charts and a “Chart in Control %” column showing the percentage of nested Charts that are in control can now be added to the List and Tree Views.
 Impact Credit Splitting (Advanced ROI)
We’ve added a new feature to the Advanced ROI Add-On! Impact Credit Splitting & Allocation makes it easier to recognize the impact of individual users on improvement work and track whether people are meeting their individual contribution impact targets by assigning quantitative impact with more granularity.
Credit Splitting can be turned on - as either an optional or required element - for any template that has a Resolution enabled.
Reach out to your Customer Experience Lead to take advantage of this feature.
Advanced Filters on more Reports
Reports have been made even more powerful with the addition of advanced filters to the User, Location, Improvement, and Project Impact Reports, as well as on the User Activity, Location Activity, and Location Cycle Time Reports.
You can use these filters to drill down into different item types, statuses, and more.


Add a Comment