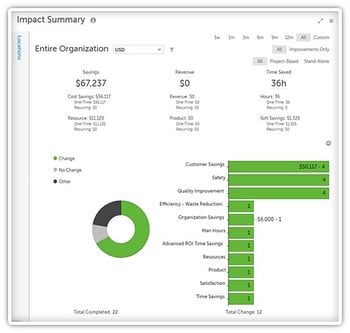
KaiNexus customers capture more daily improvements from staff, run more efficient strategic projects and events, coach more effectively, and streamline their improvement process. They engage everyone from the frontlines to the executive leaders in a thriving improvement culture to accelerate their rate of change—and it shows. The more engaged your employees are with improvement work, the more impact you’ll see.
With KaiNexus, organizations receive anywhere from 2-10x the number of ideas from their employees, and the average idea in KaiNexus is worth $15,000. Most customers also pay back their entire investment in KaiNexus by implementing one idea—now, who wouldn’t want that?
Let’s take a detailed look at how your organization can drive ROI with KaiNexus:
Return Type Breakdown
One remarkable thing about continuous improvement is that each idea can improve many areas of the business all at once. For example, improving a process to make it safer for your employees might enable them to work more efficiently and improve their job satisfaction.
As such, when we look at the breakdown of impacts reported by our customers, you'll notice that the numbers don't add up to 100. A lot of these ideas were identified as impacting multiple categories at once.
Our clients saw the following breakdown related to the type of return for each completed improvement:
- 28% of all improvements have a financial impact
- 36% of all improvements impact quality
- 11.5% of all improvements increase the safety of staff and customers
- 31% of all improvements increase staff and customer satisfaction
Because KaiNexus enables people to track the critical metrics, we have a handful of customers that also track the impact of the improvement efforts on the environment: health, product, and resources.
Financial Impact Breakdown
Let's dive a little deeper into those financial impact metrics. Our customers report impacts in a few different categories—cost savings , time savings, and revenue generation. This data is self-reported by the customers, who often have an internal verification process for their finance teams to analyze and confirm the data.
Typically, the process is as follows:
- The team who implemented the improvement or worked on the project reports their impact.
- The manager overseeing the work approves (or changes) the reported impact in KaiNexus.
- The results are sent to the finance team to verify results, who either approves the reported impact, makes changes, or requests further analysis.
So, there's the source of the data. Here's how it breaks down:
- 12% of improvements save money with an average first-year cost savings of $70,000—about 30% of which is annually recurring.
- 1.2% of improvements increase revenue with an average first-year revenue increase of just under $210,000—75% annually recurring. As with cost savings, most improvements have a comparatively small financial impact, but 1 out of every 100 improvements submitted into KaiNexus has an impact of over $100,000, and 1 out of every 50 improvements submitted has an impact of over $10,000. It adds up.
- 15% of improvements save time. Our customers estimate that the value of the time saved is an average of $6,000 in the first year—92% of their time-saving impact is annually recurring.
Keep in mind that these numbers are per improvement, not per person or organization, so they are multiplied many times over in organizations with healthy improvement cultures and the technology support necessary to make things happen.

It’s simple. The more improvements you capture, the more you implement. The more you implement, the more significant your impact. Improvement software like KaiNexus will help you become more efficient in your day-to-day improvement work, and the ROI will follow.


Add a Comment