 Ever wonder why factories, warehouses, grocery stores, and other similar businesses usually have a sign that says something like, "Accident-Free for 82 Days." It's because the simple act of measuring and reporting that number makes it evident across all levels of the organization that this metric is important. We measure what matters. No one wants to be the guy who sets the sign back to zero.
Measuring and reporting continuous improvement metrics sends a clear signal to the organization that this is important. When people know that you're tracking data around their improvement work, there's an increased sense of accountability that drives engagement and activity.
But what should you measure and how?
The most common way people manage continuous improvement work is with a mix of improvement tools, spreadsheets, and email.
Perhaps you use a physical Kaizen board that hangs on the wall. Maybe leaders get email updates when improvement projects are completed. Are improvement tasks scheduled in Outlook, while project plans live in spreadsheets? Does every department have their own tools? These situations are common.
The problem with this tacked together approach to measuring improvement work is that there is no one version of the truth. Spreadsheets are error-prone, physical boards and assets like A3s and value stream maps are difficult to share widely and don't show progression over time.
The solution is to invest in improvement management technology that unifies all of your improvement information into a single platform, giving momentum your improvement efforts and streamlining the reporting processes. More people can participate, and you can accurately track your engagement, activity, and impact metrics.
Activity Metrics
Understanding what kind of improvement is happening and at what frequency is the first step in assessing your improvement culture's health. This information will show you how hard the organization is working toward positive change, who is actively involved in the effort, and where more training or coaching is needed.
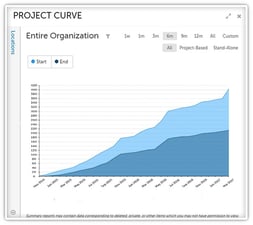
 Improvement Curve
Ideally, improvements should be completed at about the same rate as new opportunities come into your system. Projects that stall out after being identified bring down morale, decrease engagement, and reduce impact. You should be able to check the percentage of in-progress improvements at any time and more impact by increasing that number.
Status Reports
Visibility into the status of all improvements helps you to assess how well work is progressing from stage to stage. There are few overdue improvements in a healthy improvement culture because people prioritize getting this work done to enjoy the positive impact: the healthier your culture, the more significant the ROI.
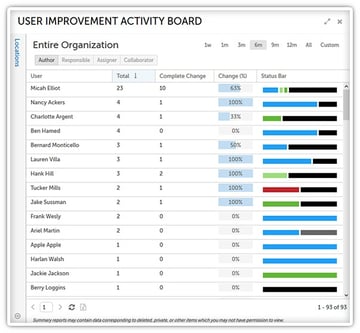
User and Location Boards
Boards based on individual users, teams, and locations help you measure the activity throughout the organization with nuance, so that you can coach better. See who is overloaded, who needs coaching to drive improvements through to completion, and who to recognize for great work.

Engagement Metrics
By tracking who is actively working on improvement projects over time, you can find averages, compare current results to those averages, and find out if there are any trends. You discover whether the ROI you've achieved is due to a small group of people, a sign of an undeveloped culture, or a large group, indicating a vigorous culture.

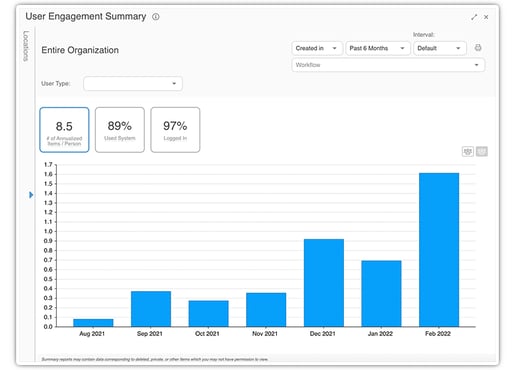
User Engagement Summary
The engagement summary will tell you how many improvements people submit per year on average and the percentage of people who are active in your improvement management system. This gives you a view into how wide your improvement culture goes.
Location Engagement
Looking at engagement by location will help you identify leaders that are doing an excellent job of motivating teams. The best practices they rely on can be transferred to less active parts of the organization.
User Participation Rates
A small group of users making a big impact might be an unsustainable anomaly. The idea participation rate report will show ROI being spread over many people and departments.
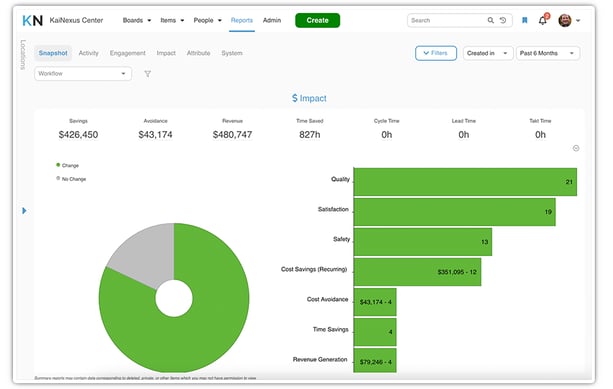
Impact Metrics
The impact of improvement on the bottom line is crucial. In addition to financial metrics, it's also imperative to track qualitative variables such as time savings, safety enhancements, health, and environmental impact.

Continuous improvement software allows you to connect improvement with impact in your reporting so that you can drill down into any number to verify accuracy. If you see a cost reduction that looks impossibly high, for example, you can quickly see what improvements are contributing to that and validate that the reporting impact on each is correct.
Measuring the right things will help you get more out of your improvement efforts. It will make it easier to justify continued investment and help you find areas where your culture could use a boost. Perhaps more importantly, it will prove to you and your team that improvement is something that can be controlled and managed.


Add a Comment