It just got a little easier to get quick insight into the health of your improvement culture - whether you’re interested in your organization as a whole or just your own locations.
You can now add certain Reports - Submission vs Completion, Engagement Summary, Impact Summary, and/or User Engagement by Role - to any of your Boards, and filter them to meet your specific needs.

For help adding Report Cards, take a look at this support page.
Why would I want to add a Report to my Board?
Time Savings
When you log into KaiNexus, the first thing you see is your default Board. Rather than taking the time to navigate to the Reports tab, open the Report you want to see, and set the filters, why not just add the already filtered Report to your default Board? That would save you some time and effort and let you check out important statistics as soon as you log in!
Check in on Your Department

Suppose you’re leading the continuous improvement efforts in your department. Wouldn’t it be helpful if you could easily check to see how many people are getting involved in the work taking place in KaiNexus?
- The average number of Improvements each person submits per year.
- The percentage of people who have logged into KaiNexus.
- The percentage of employees who have done more in KaiNexus than just logging in.
To filter an Engagement Summary Report Card to include only your location (such as your department, work group, etc.) or a certain time frame:
- If you’re working with a public Board and want everyone to see their locations (not just yours), be sure to set the locations filter to “User’s Current Location.” Otherwise you can manually enter each of your locations into the filter, or use the “Current Location” setting.
- If you’re only interested in recent engagement, configure the dates filter to the appropriate time frame.
Stay Up to Date with Your Organization’s Impact
One of the easiest ways to inspire engagement with your organization’s continuous improvement efforts is to show the impact of previous efforts. With an Impact Summary Report Card, you can see the impact of completed Improvements and see how many Improvements resulted in a change, no change, or third option (that may have been set by your organization).
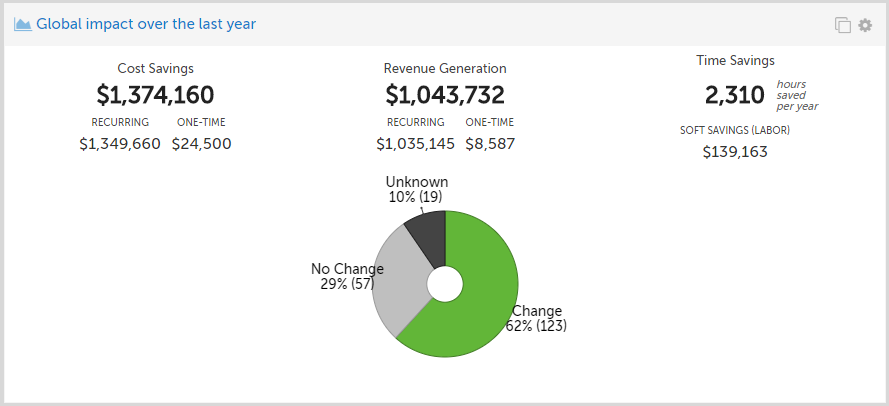
You can check out the monetary impact of your organization’s improvement work displayed across the top of the Card, including the cost savings, generated revenue, and the soft savings due to time savings.
To filter an Impact Summary Report Card for executives:
- To display information from the entire organization, do not add any locations to the location(s) filter.
- If you’re only interested in the recent impact data, configure the dates filter to the appropriate time frame.
- Depending on your interests, you can also control whether all Improvements, only Improvements that are part of a Project, or only Improvements that are not part of a Project.
How do you plan on using this new feature? Leave a comment and tell us about it!


.svg)


Add a Comment