There are 20 different Reports in KaiNexus - 25, if your organization is using the Incident Reporting Add-On. That’s a ton of data at your fingertips. Today, I thought we’d talk about some of my favorite activity Reports.
Improvement Curve

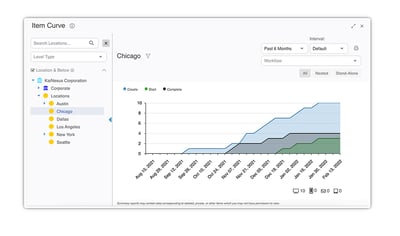
The Improvement Curve shows the number of submitted and completed Improvements in light and dark blue, respectively. You can control over what time interval, Locations, or various other filters data should be drawn, as well as decide whether only Improvements that are nested under Projects (called “Project-Based”), Improvements which are not nested (called “Stand-Alone”), or both should be included.
You can also add a yellow Target Line to the curve to track a goal.
You can even see how many Improvements were submitted via the desktop app, mobile app, or email in the bottom right corner of the Report.
So what’s so great about this Report? Well, Project-Based Improvements give you insight into your top-down efforts while Stand-alone give you insight into your bottom-up efforts! This is one of the most important Reports to analyze the health of an improvement culture.
- A high slope of submissions and completions indicates a healthy improvement culture.
- An inflection point in the slope of submission and completion usually reflects a change in leadership behaviors or improvement processes.
- A low slope of submissions and completions is a warning sign of an unhealthy improvement culture.
- If you have more improvements being submitted than being completed, you have divergence. This risks slowing down your improvement efforts, decreasing engagement, and ultimately damaging your improvement culture.
If you want to learn more about the value of small improvements, check out this video. And for more information on the importance of identifying, reporting, and solving problems, this is the video for you.
User Improvement Activity Board

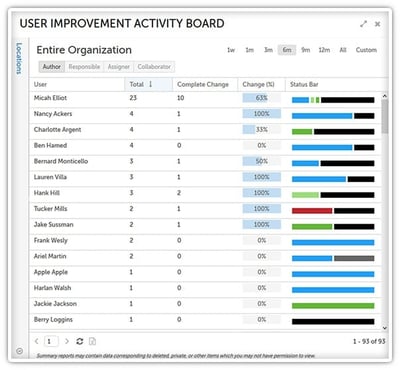
This Reports shows how much activity a person has had in the system, according to what roles they played on every Improvement. You can control over what time interval, Location, or various other filters data should be drawn. As with the Improvement Curve Report, you can decide whether only Improvements that are nested under Projects (called “Project-Based”), Improvements which are not nested (called “Stand-Alone”), or both should be included.
It breaks down the number of Improvements completed with a change and the current status of each of the Improvements. You can click on any column to drill in to see the actual Improvements being reported on.
This Report is vital for managers and continuous improvement coaches to see who is doing well and who needs help. Look for:
- People who submit lots of Improvements which result in no change. They might need coaching on what continuous improvement is and how to come up with implementable ideas.
- People who submit lots of Improvements that result in change - they deserve a shout out!
- Leaders in Locations with low change rates are having a hard time finding ways to implement some aspect of an Improvement. Try to understand why implementation rates are so low.
To learn about the importance of finding something to implement, I'd recommend watching this short video.
Location Improvement Cycle Time Board

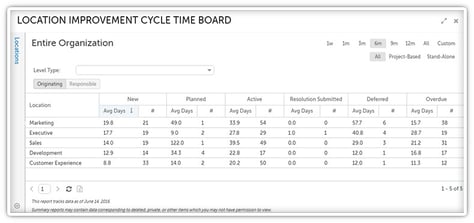
This Report shows the average number of days Improvements in each Location stayed in each status of the time interval, filter settings, or Locations and/or Level Types selected, as well as the total number of Improvements in that Location that are currently in each status. As before, you can decide whether only Improvements that are nested under Projects (called “Project-Based”), Improvements which are not nested (called “Stand-Alone”), or both should be included.
This is an incredibly helpful Report for continuous improvement coaches to see how fast Improvements are passing through the improvement cycle. Look for:
- Areas that have long cycle times. They are likely either not spending enough time working on improvement or are picking efforts that are too broad in scope.
- Areas in which Improvement are spending a long time in the “new” status. Leadership may be failing to respond quickly and assign new Improvements.
- Areas in which Improvements are spending a long time in the “resolution submitted” status. Leaders may need to be reminded of the importance of promptly reviewing submitted Resolutions.
For a quick primer on the importance of respnding quickly to employee engagement, give this video a view.
These are just a few of the Reports KaiNexus offers. In fact, each of these Improvement-based Reports has a Project-based counterpart!
What are some of the Reports you use on a regular basis? We’d love to hear from you.


Add a Comment