I’m always on the lookout for cool Boards that I can “borrow” for my own use in KaiNexus, and when I recently discovered PICK charts configured with Weighted Scores, I knew that I had to share with you.
I’m sure I’m late to the party and you know all about PICK charts, but just in case, let’s review.
In our scenario, a PICK chart is a tool useful for visualizing the relative value, risk, and feasibility of a large number of improvements. They’re commonly used after a brainstorming session to help people choose which improvements to work on.
I’ve known about setting up PICK charts in KaiNexus using attribute values (as described here), but never really thought about how this Board functionality could be combined with weighted scoring to create a more objective, automated filtering system for the cards.
That’s what I’d like to share with you today.
Weighted Scores is a feature introduced to KaiNexus back in 2018. Lots of our customers use this feature for evaluating the improvement ideas submitted by their staff. I love this method of categorizing ideas because it’s:
- Transparent
There’s nothing worse than submitting your idea for consideration, only to have it shot down by a committee without understanding why. Weighted scoring in KaiNexus makes it possible for the committees to share what criteria they used to evaluate the idea, and how the idea scored in each category. - Objective
When KaiNexus is automatically scoring your bottom-up improvement ideas, there’s no question of why some were selected and others were rejected. They either make the grade or they don’t, and personal biases or company history don’t come into play. - Automated
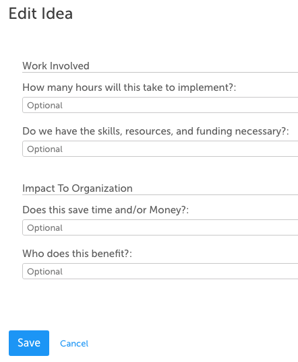
Lots of our customers set up their weighted scoring so that people answer a series of questions about their ideas regarding available resources, strategic fit, and benefit, which then automatically - and instantly - generates the score. This saves time for the committee and gives instant feedback to the employee.
Your Account Manager can help you set up the weighted attributes you’ll need to get Weighted Scores working, at which point you can go in and tweak all of the details to achieve perfection.
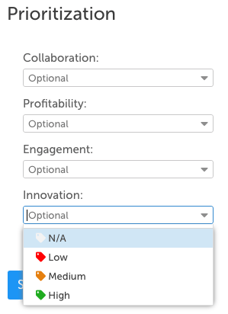
Some organizations choose to have employees self-report data when entering their ideas so that a prioritization score is automatically generated (as discussed above). Others elect to have a committee evaluate each idea and answer those questions, so that they have more control over the accuracy of the data. It’s possible to give employees visibility into the criteria that were used to score their ideas, as well as to just show the final score without publicizing the criteria. The amount of transparency and control you want here is totally up to you!
Then this is where PICK charts come into play.
If you have 100 - or 1,000 - front line employees submitting opportunities for improvement, how do you suss out what to work on vs. what’s too hard, or too low impact? How do you prioritize scarce resources? And how do you scale that effort to accommodate an increasing number of ideas?
By filtering cards on a PICK chart Board!
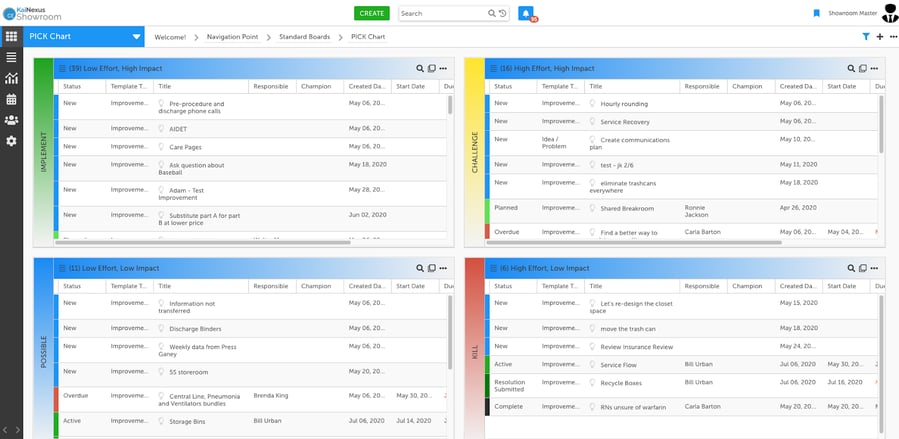
To begin, you’ll want to create a PICK chart Board with four cards on it. There’s lots of variability in what these cards can be named, but essentially, you’ll want a quadrant each for:
- Low Effort, High Impact
- High Effort, High Impact
- Low Effort, Low Impact
- High Effort, Low Impact
Using filters on these cards, you can use your Weighted Scores to achieve pinpoint accuracy. For example, your Low Effort, High Impact card might contain any improvement with an effort Weighted Score of less than 5 and an impact Weighted Score of greater than 5.
Typically, you’ll want to react to improvements in each quadrant as follows:
- Low Effort, High Impact: These are no-brainers to decide to implement, and are typically assigned to teams for implementation right away.
- High Effort, High Impact: Ideas in this quadrant are likely to be evaluated by a committee, since they’re often time and resource intensive. If selected for implementation, they’re likely to be converted into a Project.
- Low Effort, Low Impact: These ideas are also likely to go to a committee for evaluation - some of them will be worth implementing because they’re so easy, even though the impact is low - and others will likely be rejected as not worth it.
- High Effort, Low Impact: Ideas in this quadrant are usually not implemented, but good leaders are sure to take the time to reach out to the authors to discuss why.
So, what do you think? Can you combine a PICK chart Board with Weighted Scores to improve the way you prioritize and visualize your bottom-up improvement? Reach out to your Account Manager for help getting this set up!


.svg)


Add a Comment