If you’re familiar with quality control, you’ve probably encountered the seven basic quality management tools:
-
Cause-and-effect diagrams
-
Check sheets
-
Control charts
-
Histograms
-
Pareto charts
-
Scatter diagrams
-
Stratification (flow/run charts)
In this blog post, we’ll be looking at Pareto charts - what they are and how KaiNexus customers are using our system to support them.
What is a Pareto chart?
A Pareto chart is a vertical bar graph in which values are displayed in decreasing order of relative frequency from left to right. That makes these charts great for analyzing which problems need your attention first - the taller the bar on the chart, the greater cumulative effect that variable has on a given system.
A point-to-point line graph is often superimposed on the bar graphs showing the cumulative relative frequency.
Why does that matter? If a Pareto effect is present, this line will rise steeply for the first few variables and then level off.
Both of these elements together help you quickly see which variables hit the 20% mark that is most critical, letting you discover which variables are the “vital few” that should be addressed as soon as possible and which are the “trivial many” that can stand to wait.
When should you be using Pareto charts?
Just about any time!
Early in your quality improvement efforts
Pareto charts are incredibly useful when you’re getting started with a new round of quality improvement, helping you figure out which variables and factors are responsible for the most complaints, losses, or other damages. This lets you know where you should first be spending your improvement resources.
Later in your quality improvement efforts
Once you’ve chosen a project and gathered a team to improve it, how do you decide what exactly the team should focus on? Business problems are typically multifaceted, so it can be hard to choose the best angle from which to work.
Pareto charts are able to help you gather data on each possible source of the problem, figure out which account for the greatest number of incidents, and choose the best areas to focus on.
 An Example in Action in KaiNexus
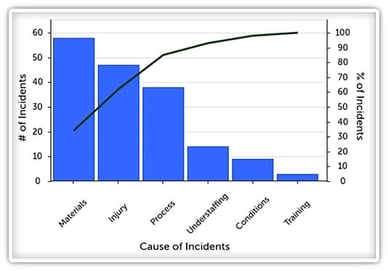
This chart easily lets you see which variables have contributed to the greatest number of incidents, and therefore which need to be addressed most urgently.
“Materials,” “Injury,” “Process,” and “Understaffing,” the bars furthest to the left and contributing the most to the total number of incidents should be the primary focus of any improvement efforts. What makes these bars so important? They each contribute more than 20% to the total number of Incidents.
How does KaiNexus support Pareto charts?
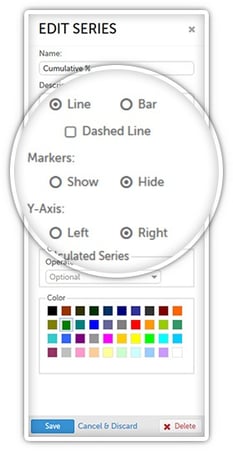
KaiNexus gives you a ton of control over exactly how your charts should be structured. When creating each data series on the chart, you can specify:
- Whether the series should be displayed as a line or as a bar. This lets you build the standard Pareto chart with one barred series and one lined series.
- For the line graph, you can even decide whether the markers - the dots signifying each data point - should be shown, or if the series should be presented as one continuous line.
- Which y-axis the series should follow. This lets you align the bar graph with one axis and the line graph with the other so that one does not affect the breadth of the other.
By editing the chart’s options, you can control:
- The title of each axis - the x-axis, left y-axis, and right y-axis.
- The range of each y-axis. This is great because, for example, you can force the y-axis following the cumulative percentage data series to extend from 0 to 100, regardless of the actual lowest value.
How have you been using Pareto charts to support your quality improvement efforts? We’d love to hear from you in the comments!


.svg)


Add a Comment