2017 has been an incredibly busy year for our team here at KaiNexus! At our User Conference earlier this month, our CEO and Co-Founder, Greg Jacobson, discussed how we’ve grown as a company over the years, and how the KaiNexus platform has grown alongside us.
In the last year, we have released ten new versions of KaiNexus. Those ten releases were comprised of 257 enhancements - that includes improvements, new features, and bug fixes. We’d like the take this opportunity to go over some of the top enhancements, just in case you missed their announcement.
While this blog post IS awesome, I do recommend watching this video for a more... engaging experience.
2017 KaiNexus UC - Year Overview from KaiNexus on Vimeo.
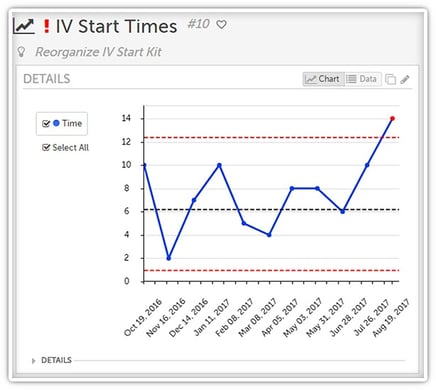 Control Charts
With control charts in KaiNexus, your life can get a bit easier. You just need to set an upper and lower control limit, and then enter your data as usual. If your data ever goes outside of the limits, you can have the chart set to give you an alert!
- Pareto Charts
You could always manually build a pareto chart in KaiNexus, but now we can automatically create one for you based on the data you enter - the system will calculate the accumulative percentage of each data point and generate the correct line, and each bar on the chart will be ordered in descending order without you having to manually order them. - Bowling Charts
Bowling charts are simple, visual ways of monitoring Key Performance Indicators or other objectives, letting you compare your actual metrics to your targets and goals. With KaiNexus, you can set them to notify you when the metrics you're tracking fail to meet the primary or secondary target. - Calculated Data Series
We received a lot of feedback from customers saying that they wanted to be able to measure a couple sets of data, and then use that data to calculate a new data series for the chart. We thought that was a great idea, so we implemented it! KaiNexus can now calculate the sum, difference, average, percent, or percent change of your various sets of data for you. - Control Columns on Cards
You can control what columns should be displayed on a list Card every time someone accesses it. You can even set it up so that different columns will be displayed if someone expands the Card. - Improved Chart Card Options
If you have a chart on a Board, you might want a different experience than if you were to look at a larger version of the chart. You can configure a Chart Card to show only the data series you’re interested in and control where the legend is displayed. If you expand the card, you will still see it in its entirety. - Kanban View
Kanban boards are a visualization tool that help people understand their improvement workflow, and we realized that they are insanely popular with our customers. As such, we added the ability to display any list of Improvements, Projects, or Tasks in the Kanban View.  X-Matrix
Many organizations conducting a formal Strategy Deployment process use X-Matrices to develop and implement tactical and strategic plans, coordinated across people throughout the organization. You can now add an X-Matrix Card to any of your Boards to make the matrix interactive and centralized.
The X-Matrix module is turned off by default because we know not everybody uses them, but just reach out to your Customer Experience Lead and we can turn it on.- Enhanced Quick Search
We’ve added three quick search options - you can search by relevance, exact match, or advanced logic.
“Relevance” interprets what you’ve entered and returns a list that the algorithm thinks you might have been searching for. That means it will be much more forgiving of typos!
“Exact” searches for items that precisely match the text you entered. This is great if you’re certain of what you’re looking for and don’t want near matches to be returned as well.
“Advanced” brings boolean logic into play. It lets you search for keywords even if you only know the first few letters, items that contain several keywords, items that contain either of several keywords, items that contain one keyword but not another, and so on. - Markdown
Markdown is a simple way to create formatted text, such as adding bold text, numbered lists, italicised lists, etc. If you want to change an existing text area on an idea template into a markdown field, reach out to your Customer Experience Lead.  Similar Items
When you start entering in the name of your new Project or Improvement, you might notice the magnifying glass next to the title field get a little blue badge. That’s telling you that there’s an existing Project or Improvement that has a similar title.
We recommend that you take a look and make sure you’re not submitting an idea that has already been submitted. You might even find a completed Improvement about what you’re reporting, and that might give you some ideas about how to solve the problem in your own department.- Sticky View
KaiNexus remembers your viewing preferences!
For example, if you always go into the Create screen and always open the “Team” subsection, KaiNexus will remember that, and that section will be opened for you every time you go to the Create screen. If you never open the “Team” subsection, it will be closed.
If you’re looking at the Improvements section and you put the list in the Kanban View, it will remember that and appear in the Kanban View the next time you open that section.
If you’re in the Reports section and you set it to only show data for Location A, your settings will still be there the next time you come to the Reports section. - Tasks
Tasks can be stand alone, they can be planned and deferred, they can be bulk edited, you can look at them in the Kanban View, they can have Followers, you can can copy and convert them, and you can add links and attachments. And if you want multiple Task types, we can do that for you!
We added dependencies, too! If you have several Tasks that need to be completed in sequence, you can set up a dependency: when Task A is completed, Task B will become active; when Task B is completed, Task C will become active; and so on. - List Views
We’ve added a whole bunch of status bars to the List View. You can see how many Projects, Improvements, or Tasks nested under a particular parent are in each status. You can also add a “Complete %” column for each of those nested idea types which shows what percentage of ideas nested under a parent have been completed.  Mixed Tree View
People asked to be able to see all the nested Projects, Improvements, and Tasks in the Tree View without having to go to another list, so we made it possible!
Now, for example, if you look at the Project Tree View, you'll be able to see every Project, Improvement, and Task nested under each parent Project.- Improved Filter Options
A lot of our customers expressed an interest in building bottleneck Boards, but to do so, they needed a way to filter by bottleneck… So we added bottleneck filters!
We also added a “None” and an “Any” option to every Attribute filter.
An finally, we added logic filters so you can say whether you want A and B or A or B, giving you more control over your filters. - Detail Area Customization
You can customize the Project, Improvement, and Task “Details” areas more than ever before. You can control how many columns there should be and can add headers if you want to split the fields and Attributes into different categories. Reach out to your Customer Experience Lead to update your templates! - Customize Nested Areas
We’ve given you a lot more control over the appearance of the nested Improvement, Incident, Project, and Task areas. They work more like the controls of Cards now. You can decide your personal preferences and, with the right permissions, set the default appearance for anyone else looking.
- Improved View Permissions
We are big advocates of transparency and KaiNexus is largely based on the idea that improving visibility and breaking down silos is hugely beneficial. But some organizations have certain departments or teams for which transparency doesn’t make a lot of sense from a practical standpoint - and sometimes from a security standpoint.
So we’ve given you the opportunity to configure who can view ideas in which locations. - Add a Note to an Attribute
If someone picks a particular Attribute when working on an Improvement, you can have a note field set to appear so that they can cdd their thoughts about that Attribute. This is especially great for an Attribute where someone picks “Other” or “Misc” - without a note, you would have no idea what they meant. - Improved Layout Order
The “Resolution” section was moved up on the “All” tab of an Improvement so that it is now right under the “Details” section. It contains important information! It shouldn’t be hidden at the bottom of the page.
And if there is no Resolution yet - or no Tasks or Charts - those sections are hidden from the “All” tab until they become relevant. - Improved Reports
Maybe you have a goal of getting over one Improvement per person per year in your department. Adding a Target Line to the Improvement Curve or Project Curve Reports lets you monitor your department’s progress towards that goal.
Status bars have been added to the User Activity and Location Activity Reports for Projects and Improvements so that you can see at a glance how each location is fairing.
We added four new Project Reports - User Project Activity, Location Project Activity, Project Statuses, and Location Project Cycle Time - which mirror the previously existing Improvement Reports. - Premium Security Module
The Premium Security Module includes audit tracking and supports ip whitelisting, restricted email content, domain restricted emails, Single-Sign On, and HIPAA/BAA compliance.
You should note that if the only part of that that you’re interested in is Single-Sign On, that feature is available as an independent module as well. Reach out to your Customer Experience Lead for more information. - Incident Reporting Module
We believe incident reporting shouldn't be totally seperate from continuous improvement. As such, we introduced the Incident Reporting Module to better enable reporting, tracking, and resolving incidents.
This module introduced the a new kind of user: Incident Only users can log into the system like an Active user, but they can only submit Incidents and can only see their own Incidents.
This module also adds five new Reports which mirror the Improvement Reports with which you’re familiar so that you can track your incident reporting efforts separately from your Improvements and Projects.
Like I said, we’ve had an unbelievably busy year!


.svg)


Add a Comment