When you’re starting out on your continuous improvement journey, it’s important that you keep yourself informed about how Lean is spreading throughout your organization. From the very top level to reports on individuals, KaiNexus has got your back.
We have three Reports which can tell you a lot about the overall health of your improvement culture:
The User Engagement Summary
 This Report tracks the average number of Improvements submitted per person, the percentage of users who have logged into KaiNexus, and the percentage of users who have used the system for more than just logging into it.
If you’re interested in the engagement metrics for a particular location or time frame, you can filter the Report by either of those criteria.
You can also click the people icons to see a list of users who meet or do not meet the following criteria: submitted an Improvement, used the system, and logged in. That lets you quickly see who needs some guidance when it comes to being active in KaiNexus.
The User Participation Summary
T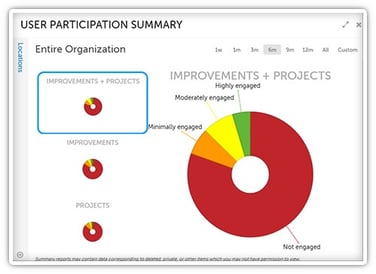 his Report tracks how many people are working with Improvements and Projects as authors, responsible people, assignors, facilitators, leaders, sponsors, and participants.
You can see the percentage of users that are highly engaged (associated with six or more Improvements or Projects), moderately engaged (associated with two to five Improvements or Projects), minimally engaged (associated with one Project or Improvement), and not engaged (associated with no Projects or Improvements).
Like with the User Engagement Summary, you can filter by location and time frame so that you can see just the data in which you’re interested.
Location Engagement Board
 This Report tracks user engagement on a per location basis. You can use it to quickly see the percentage of people in each location who have logged into KaiNexus, used the system beyond logging in, or submitted an Improvement. You can also see the average number of annualized Improvements in each location.
You can still filter by location and time frame, but you can also filter by level type so that you can see all the data surrounding one type of group.
You can also export this Report as an Excel spreadsheet so that you can run your own analytics.
You can also narrow in on the activity going on in certain locations or with certain individuals.
Location Activity Board
 This Report lets you drill down into any location in your organization. You can use it to easily find those that are actively involved in your culture of continuous improvement and those which need a little more coaching.
As with the other Reports, you can filter by location and time frame, but you can also filter by level type - as discussed before - and by originating and responsible locations.
You can also export this Report as an Excel spreadsheet so that you can run your own analytics.
User Activity Board
 You can zoom in even further with this Report. It gives you the details of your team’s activity on a person by person basis.
You can still filter by location and time frame, but you can filter by improvement role (author, responsible, assigner, or collaborator) to get a better understanding of exactly how each person is engaged.
You can also export this Report as an Excel spreadsheet so that you can run your own analytics.
How have you been using your KaiNexus Reports? We’d love to hear from you!


.svg)


Add a Comment