 I briefly touched on the Project Curve in a previous blog post, but this Report is so important that I felt it prudent to give you a more comprehensive explanation.
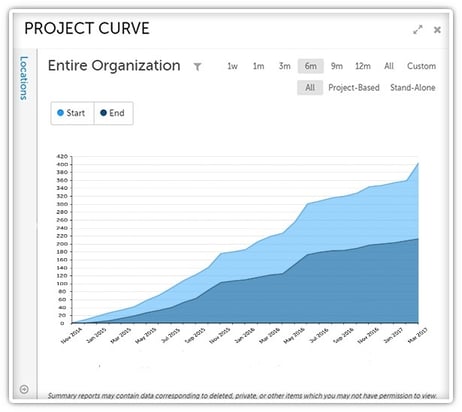
The Project Curve Report lets you assess the growth of your improvement over time by tracking the start and end rates of your organization’s Projects.
Typically, Improvements and Projects will have different traits. In most organizations, there will be fewer Projects than Improvements. It is also typical for Projects to take longer to be completed than it does Improvements.
We have found that organizations that tie Projects directly to their strategic goals are often more successful than those that don’t. It also seems to be advantageous for your organization’s Projects to have a practical cycle time; if it takes too long for Projects to be completed, people may lose motivation.
What should you be looking for?
- A high slope of Projects starting and ending indicates a healthy improvement culture.
You should also be aware that having too many active Projects can often decrease their completion rate. Of course, every organization will have a different Project completion capacity. You Improvement leadership should study your organization’s characteristics in order to maximize their top-down improvement potential.
- If there’s an inflection point in the starting and ending slopes, there was probably a change in improvement processes or leadership behaviors.
- A low slope of starting and ending is a warning sign of an unhealthy improvement culture.
Studies have found that about 20% of an organization’s improvement potential comes in the form of larger in scope top-down improvement projects. We know that when this slope is low, it often has more to do with the fact that Projects are occurring in the organization but that KaiNexus is not being used to track them.
Keep an eye out for divergence
If you have more Projects being started than ended, you have divergence. This warning sign needs to be quickly resolved to avoid having your improvement efforts slowed and damaging your improvement culture.
Because the cycle time for completing larger top-down Projects will be greater than smaller scoped Improvements, divergence will play a larger role in your Project Curve than your Improvement Curve. Having said that, having too large of a cycle time for Projects can result in them either no longer being considered a high priority. This can stop Projects from being completed altogether or have some much delay that by the time they’re completed, they’re no longer relevant.
Naturally, this will be very organization-specific and will be heavily influenced by the scope of the Projects.
So what can you do about divergence? Make sure people are ending Projects when they reach their end date or that the end date is pushed back a bit with an explanation of why the original date was not met.This will signify that leaders are taking improvement seriously, which in turn will make their employees take it seriously as well.
How are your Project Curves looking? We’d love to hear from you!


.svg)


Add a Comment