Hey everyone, long time no see! Your KaiNexus development team has been hard at work and we are proud to present our latest release: 2.2.8!
Let’s take a look at some of the highlights:
Time Tracking
![]() Give projects an estimate and log users' time to track how long a project actually takes to complete in KaiNexus. To take advantage of this new feature on your workflow template(s), be sure to reach out to your customer experience representative.
Give projects an estimate and log users' time to track how long a project actually takes to complete in KaiNexus. To take advantage of this new feature on your workflow template(s), be sure to reach out to your customer experience representative.
Once enabled, you’ll see a new Time Tracking section appear below the "Dates" section within your project. Begin by giving your project an estimate. Your team members on the project can go in and log their time with a description of what work was done.
Need to adjust your estimate? Not a problem! You can choose to update your estimate or include a new estimate at any point to weigh against your original estimate. Time is of the essence here, people!
Threshold Charts
Let’s give a big warm welcome to Threshold Charts in KaiNexus! You said it was important to measure progress with goals and baselines as well as send out the proper notifications when you hit or miss those goals/baselines and we 100% agreed! Threshold Charts are used to track when you are above or below a threshold or a series of thresholds. If you have a metric that you want to track when you are above/below a baseline/goal, then you will definitely want to take advantage of this new chart type!
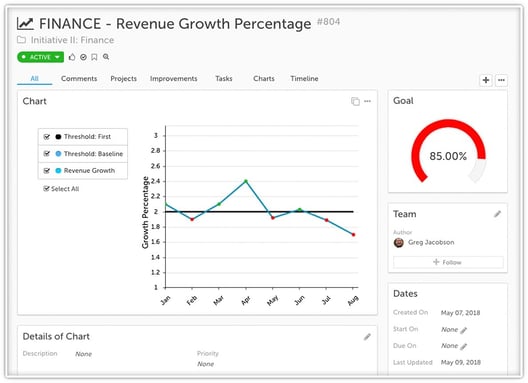
Goal Visualizer
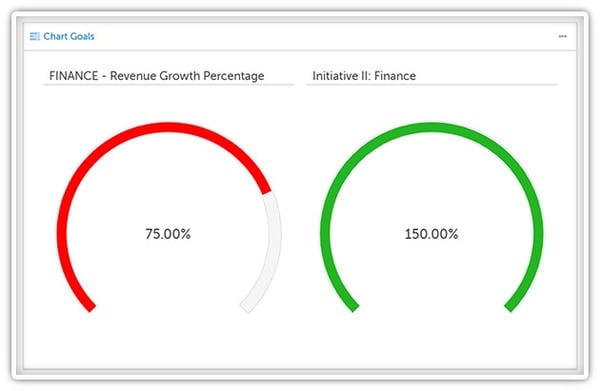
You didn’t think we would stop there with Threshold Charts did ya? With being able to set a goal on a Threshold Chart, you can now also show how close you are to your goal from your baseline by adding a goal visualizer to your chart. We’ve even added the option to put that goal visualizer on a board via a new card type called a widget card. This widget card supports our goal visualizer and even lets you put a bunch of different goals on one card. This gives you a quick, at-a-glance view of how close you are to completing a goal set on your Threshold Charts. We know you are going to love this! Keep an eye out for when we add more options to that widget card down the line, too.
Investment on Improvements (Advanced ROI Add-On Module)
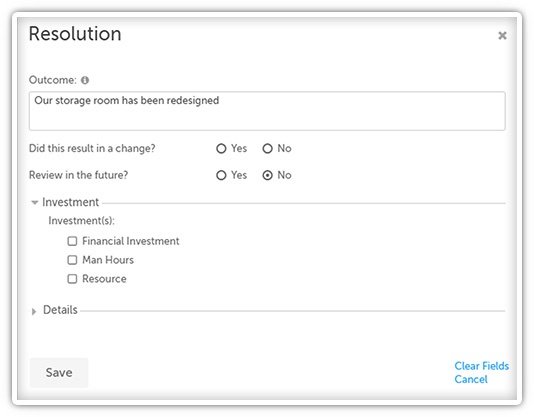
Measuring the impact of an improvement is a huge part of tracking improvement efforts. Showing how much was invested to complete the improvement can be just as important! With “Investment” (available as part of the Advanced ROI add-on), you can now track time, funds, and resources invested towards an improvement to see just how much the impact actually stacks up.
Impact Splitting (Advanced ROI Add-On Module)
Currently, you can view Impact in two different ways: from the location the improvement originated in and from the location that was responsible for implementing it. For our Advanced ROI customers, you now will be able to determine and allocate where the impact of the improvement actually took effect using Impact Splitting and Impact Allocation. This feature will allow you to divide up what locations of your organization were actually impacted by your improvement and then allows you to measure that using the Location Impact Report.
With 52 improvements and enhancements in this release, we could be here all day! Make sure you check out our release notes for the details on the rest of those new features. Also be sure to reach out to your CE representative with any configuration assistance. Until Kai-next time, this has been your Customer Enablement Manager, Ryan Rippey, keep improving everyone!


.svg)


Add a Comment