Our development team is comprised of some of the busiest people I know. They’ve been hard at work in the past few weeks to bring you 24 new features, improvements, and bug fixes. Here are some of the highlights:
Attribute notes
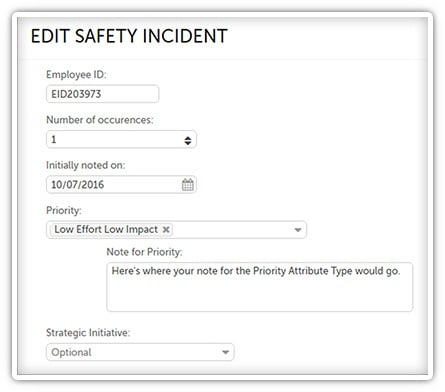
 Sometimes your Attributes need some extra explanation to be clear. For example, if one of your Attributes is simply “Other,” you probably want your team to be able to express what exactly “Other” means. With this latest version of KaiNexus, you can add a note field to any Attribute you want so that your team can elaborate when necessary.
How? It’s easy! If you’re an administrator, just go to the Attribute Type you want to work with in the admin section. Edit any Attribute like you usually would, but notice that there’s a new checkbox labeled “Include Note.” Checking that box will prompt users to enter a note when the select that Attribute. If you want the note to be required, check the box next to “Require Note.”
When you add an Attribute with a note field to a Project or Improvement, the note field will appear under the Attribute field. It will be labeled “Note for [Attribute Type].” If you add multiple Attributes with notes to that field, only one note field will be displayed.
Configure the layout of Cards
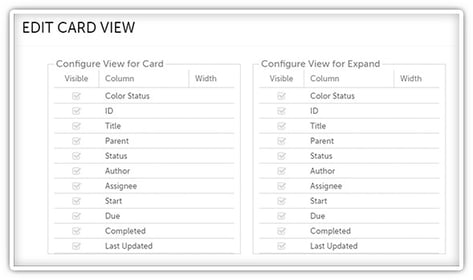
 You can permanently configure which columns should be displayed on the List, Tree, or Kanban View on any Project, Improvement, Task, or Incident (if your organization has the Incident Add-On) List Card. These settings will be retained even if you log out of the system and - if it’s on a public Board - everyone will see the same setup. You can also configure which columns will be displayed in the expanded view of such a Card.
This is great because it keeps you from having to reset your column preferences every time you refresh the screen or log back in.
The left side of the Edit Card View window configures the settings for the Card itself, while the right side configures the settings for the expanded view of that Card. Check the boxes next to columns you want to be included and uncheck those you don’t. You can also set the width of each column by adding the appropriate value to its “Width” field.
Activity Reports
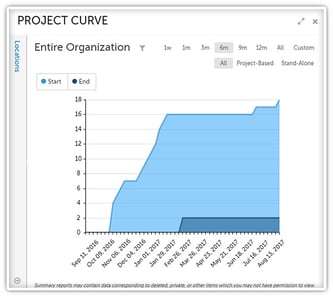
 This release introduces a new Activity Report - the Project Curve Report. This Report lets you identify trends relating to Projects in your improvement culture over time. It tracks the number of Projects started versus the number that have been completed.
If there’s a high slope of Projects starting and ending, you probably have a pretty health improvement culture. However, if you have more Projects being started then ended, you have divergence. This can slow down your improvement efforts, decrease engagement, and ultimately damaging your improvement culture. It’s important to make sure people are ending Projects when they reach their end date to signify that leaders are taking improvement seriously.
These are only some of the awesome changes we’ve made; there’s still lots more for you to explore. What new features are you most looking forward to using?


Add a Comment