Our development team has been hard at work in the past few weeks to bring you 19 new features, improvements, and bug fixes. Here are some of the highlights:
Control Charts
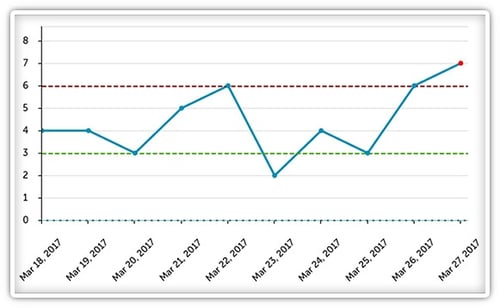
 With this latest version of KaiNexus, you can create even better control charts to monitor performance. The best part? You can set the chart generate an alert should the data become out of control. That way, you’ll never miss out on important information.
You can:
- Configure the lower, average, and/or upper limits and pick a color for each.
- Decide whether you want to have an alert sent to all members of the chart’s team if the data that is entered is out of control.
- Decide whether you want to make data point markers red if the point is out of control. Note that markers must also be enabled on the data series configuration.
So what happens when data is outside of the control limits? A red exclamation point will be displayed alongside the chart’s name on any list of charts. And if you enabled “Generate Flag,” every member of the chart’s team will get an alert.
Restrict Access to Reports and Impact Data
We’ve given you even more control over who can access what in KaiNexus with this release. We’ve added a new set of permissions that revolves around the Reports section. You'll notice the following user roles have been added:
- View: Permission to view the Reports area. Impact data from the Snapshot and the Impact Reports will not be visible. Users with only this permission will not be able to view the aggregate impact of Projects or Improvements.
- View Impact: Permission to view the impact of all work done in the organization in the Reports section as well as the aggregate impact of lists of Improvements or Projects.
** NOTE: Everyone currently in your organization’s system has been granted a new Role called “KaiNexus Reports User” that contains both of these permissions, so things will look the same to all users after this update until you make changes.
Add a target line to the Improvement and Project Curve Reports
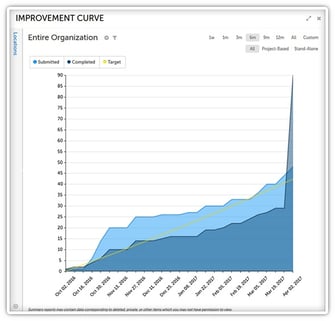
 You can now add a target line to the Improvement Curve and Project Curve Reports so that you can make sure your organization’s improvement efforts are meeting your goals.
The target line is based on the annual target rate calculated by multiplying the annual submission target you set by the number of active and offline users in that Location divided by the timeframe set for the Report. You can set a different target rate for each Location. If no Location is selected, then the target line is for the organization as a whole.
Note that the target line will not be displayed for any Location curve with a starting date before April 8, 2017 or for the entire organization curve with a starting date before June 14, 2016. You’ll need to select a date range after those dates to see the line.
These are only some of the awesome changes we’ve made; there’s still lots more for you to explore. What new features are you most looking forward to using?


Add a Comment