Our development team regularly blows my mind. This past weekend, they released 54 new features, improvements, and bug fixes. Did you hear that? 54.
Here are some of the highlights:
Dependencies
We’ve gotten tons of requests for more control when planning Ideas in KaiNexus, so we’re excited to announce the addition of dependencies!
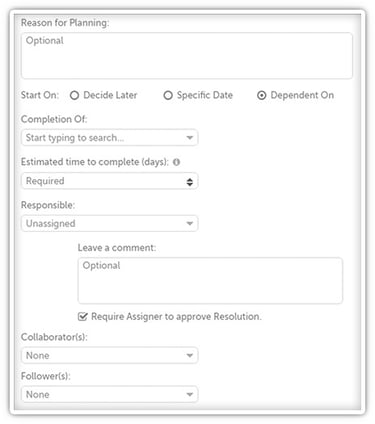
You now have three options when it comes to planning a Project, Improvement, or Task:
- “Decide Later” - Choose this option if you don’t want to enter the start date at this time. You can update the start date later or manually activate it when the time comes.
- “Specific Date” - If you already know when it should begin and who should be involved, pick this option.
- “Dependent On” - This option makes this item’s activation dependent on the completion of another Project, Improvement, or Task.
You’re probably familiar with the first two options, so I’ll just go into the new dependency settings here.
 Once you choose “Dependent On,” you’ll need to enter:
- Every item that needs to be completed before this item will activate in the “Completion Of” field. You can enter as many items as you need.
- The number of days this item will take to complete in the “Estimated time to complete” field. This number will be used to calculate the end date or due date once this Idea is activated.
- The Assignee or the Responsible in the field of the same name, depending on whether you’re planning a Task or an Improvement.
Then that’s it!
You should note that you can see a list of every Project, Improvement, or Task on which this Idea is dependent on its main page. You can also see a list of all the items depending on the completion of this item!

Update Tree View
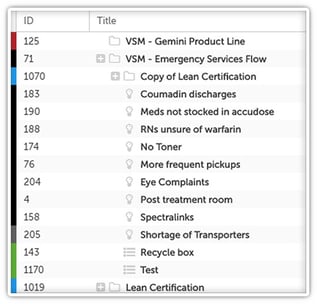
If you’ve been using KaiNexus for a while, you’ve probably seen a list of Projects in the Tree View. The Tree View lets you see the hierarchy of Projects as they are nested under parent Projects.
With the latest KaiNexus update, the Tree View now also show’s any Improvements and Tasks nested under Projects so that you can really get the full picture of relationships between items in the system.
Bowling Charts

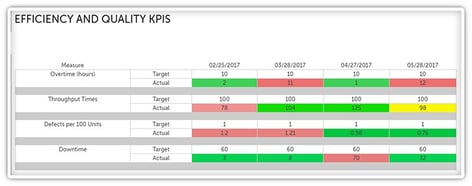
This is a big one that I know some of you have been eagerly awaiting: We’ve added the ability to create Bowling Charts!
A Bowling Chart is a way to monitor KPIs or policy deployment objectives, letting you compare your actual metrics to your targets.
To create a Bowling Chart, create a new chart as you normally would.
Then add a new series, giving it a name and, if you’d like, a description.
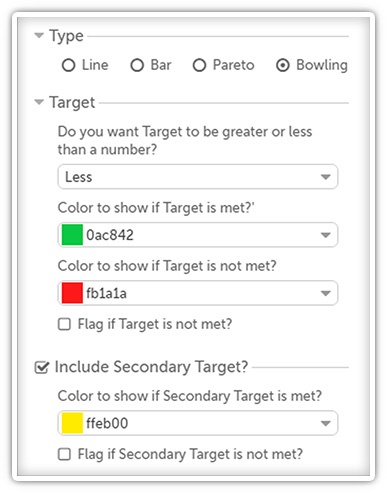
- Selecting “Bowling” under the “Type” heading.
- Decide whether your goal is for your actual metrics to be less than or greater than the target value in the “Do you want Target to be greater or less than a number” field.
 Pick which color should be used if the target is met in the “Color to show if target is met” field. People often use green.
- Pick which color should be used if the target isn’t met in the “Color to show if target is not met” field. People often use red.
- If you want an alert to be generated for people on the chart’s team if the target isn’t met, check the box next to “Flag if target is not met.”
- If you want to include a secondary target, check the box next to “Include Secondary Target.”
- Pick which color should be used if the secondary target is met in the “Color to show if secondary target is met” field. People often use yellow.
- If you want an alert to be generated for people on the chart’s team if the secondary target isn’t met, check the box next to “Flag if secondary target is not met.”
Then just save your data series and start adding rows and entering your data as you normally would!
These are only some of the great changes we’ve made. Take a look at our complete release notes for more.
What new features are you most looking forward to using? We'd love to hear from you!


Add a Comment