 The most common way organizations manage continuous improvement is with an assortment of improvement tools, spreadsheets, and email. We call this a "Franken-system."
A continuous improvement Franken-System can take many forms; you probably know them well. Perhaps you manage daily improvement with a physical Kaizen board that hangs on the wall. Maybe leaders get email updates when changes are made to the board. Do you take photos of the board so that a snapshot is captured? Are improvement tasks scheduled in a spreadsheet while project plans are kept in Word? Does every department have its approach? If so, you are certainly not alone.
The problem with this disconnected, chaotic approach to measuring improvement results is that there is no one vision of the truth. Spreadsheets are notoriously error-prone. Physical boards and assets like A3s and value stream maps are hard to share widely and don't inspire collaboration. Lack of standardization opens up improvement reporting to subjectivity and uncertainty. Data-driven leaders will doubt your results and possibly write off continuous improvement altogether.
The Solution
The way to negate this challenge is to invest in technology that unifies all of your improvement information into a single platform that simplifies your improvement and reporting processes. More people can participate, and you can effectively track your engagement, activity, and impact metrics.
Leaders will love reliable KPI tracking in a solution easy to manage regardless of how many departments participate or how many projects are going on at once.
Activity Metrics
Getting your hands around what kind of improvement is happening and how often it occurs is the first step in gathering metrics you can trust. The data will show you how hard the organization is working toward improvement, who is actively involved in the work, and which areas of the company need help to get more involved.
Improvement Curve
Ideally, improvements are completed at about the same rate at which they come into your management system. If improvement suggestions stall out after being identified, they bring down morale, endanger engagement, and reduce impact. You should have the ability to check the percentage of in-progress improvements whenever you like and drive a more significant impact by increasing that number.
Status Reports
Visibility into the status of improvements organization-wide enables you to evaluate your improvement culture's health. When all is going well, there will be few overdue improvements because team members prioritize implementing ideas and tracking their impact. A more substantial ROI is the result of a healthy culture.
User and Location Boards
The goal is to have visibility into how many improvements have been submitted, what projects people are currently working, and the change rate. You should also understand how long it takes for improvements to move from submission to completion. When these stats are trending up and to the right, your ROI will increase.
Engagement Metrics
The next focus area in your system of measurement is engagement metrics. By tracking who participates in improvement work, you can track averages, compare current results to those averages, and uncover trends. You'll know if the ROI you've attained is due to a small group of people, a sign of an undeveloped culture, or a large group, signaling a sustainable, robust culture.
User Engagement Summary
Another important metric is how many improvements people submit per year on average and the number of active people in your improvement management system. You'll know how wide your improvement culture is spread.
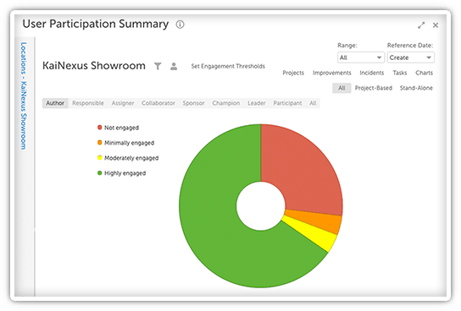
User Participation Summary
Insight into your organization's engagement level helps you identify areas contributing to your ROI and those that need more encouragement. A large ROI that results from a small group of people is less impactful and more likely to be an anomaly than a significant ROI achieved by many people from various functional areas.
Impact Metrics
Software enables you to connect improvement with impact in your reporting, allowing you to drill down into any number to verify accuracy. Suppose you see a cost reduction that looks suspiciously high, for example. In that case, you can instantly see which improvements contribute to the number and confirm that the reporting impact on each is correct.
There is no mystery when it comes to ROI reporting in continuous improvement software.
In addition to financial metrics, it's also crucial to track qualitative impacts such as time savings, safety enhancements, customer satisfaction, and environmental impact.
Tracking success toward these and other KPIs is only worth doing to the extent that you are using that data to adjust and improve processes across the organization. In this way, continuous improvement is a tangible aspect of every metric that senior executives care about.

Measuring, tracking, and responding to reporting on improvement work is the most important thing any organization can do to ensure that it meets its strategic goals and out-innovates the competition.


.svg)


Add a Comment