When we ask people about the ROI of their continuous improvement programs, literally almost no one knows. Most people track their impact of improvement in some way or another, but the data is slippery and often subjective to the extent that they're not willing to stand behind those numbers.
This is perhaps the most frustrating part of measuring improvement for most people. They try to aggregate data from across their organizations using a hodgepodge of reports that all include different information in varying formats, but they know that the result is nowhere near accurate enough to make predictions, validate budget requests, or celebrate publicly.
When you doubt the accuracy of your own impact numbers, how is that information supposed to increase buy-in for improvement from others?
To get ROI data you can trust, you need to establish a system of checks and balances based on the three CI KPIs:
- Activity
- Engagement
- Impact
Here's how getting an accurate read on these three numbers results in ROI data that holds water:
Activity
Understanding what kind of improvement is happening and the frequency at which it occurs is the first step in attaining metrics you can trust. This data will show you how hard the organization is trying to improve, who is actively involved in the initiative, and which areas of the company need coaching to get more involved.
Key areas to look at here are:
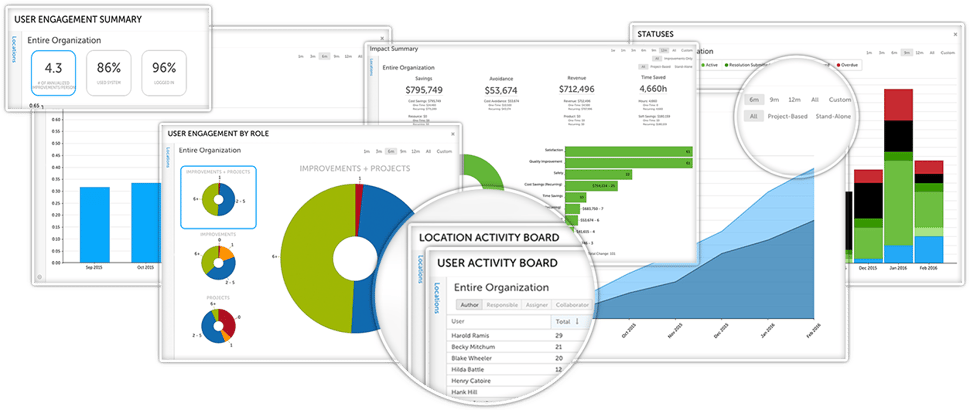
- Submission vs. Completion:
Improvements should be completed at about the same rate as which they come into your system. Those that stall out after being identified bring down morale, decrease engagement, and reduce your impact. You should be able to check the percentage of in-progress improvements at any time and drive a greater impact by increasing that number. - User and Location Boards:
You need visibility into how many improvements have been submitted, what people are currently working on, and the change rate of their past improvements. You also need to know how long it takes for improvements to pass from submission to completion. When these stats are doing well, your ROI is going to increase. - Status Reports:
Visibility into the status of improvements across the organization enables you to assess the health of your improvement culture. A healthier culture has few overdue improvements because people prioritize the implementation of ideas and tracking of their impact. A greater ROI follows a healthier culture.
Engagement
The next area in your system of checks and balances is engagement metrics. By tracking who is doing the improvement and keeping score over time, you’re able to track averages, compare yourself to those averages, and identify trends. You can tell if the ROI you’ve attained is due to a small group of people (indicating an undeveloped culture) or a large group (indicating a sustainable, robust culture).
Reports to monitor include:
- User Engagement Summary
You need to know how many improvements people submit per year on average and the percentage of people who are active in your improvement management system. This tells you how wide your improvement culture goes. - Engagement by Role
Insight into the engagement rates at every level of your organization helps you to identify areas that are contributing to your ROI and those that need more coaching. A high ROI that results from a small group of people is less significant and more likely to be an anomaly than a high ROI achieved by a wide swath of people. - User Participation Summary
Insight into which type of improvement work is contributing to your ROI - and the number of people engaged in them - also bolsters trust in you ROI data.
Impact
How improvement impacts your bottom line is the number you need to report on ROI, but it takes the first two categories of data to ensure that your impact numbers are accurate and that they reflect a predictable trend in business impact.
KaiNexus makes it possible for you to connect improvement with impact in your reporting so that you can drill down into any number to verify accuracy. If you see a cost savings that looks suspiciously high, for example, you can instantly see what improvements are contributing to that and validate that the reporting impact on each is correct.
There is no mystery - and no trust required - when it comes to ROI reporting in continuous improvement software.
Of course, I would be remiss not to mention that it’s imperative to track qualitative variables such as time savings, safety enhancements, health, and environmental impact alongside quantitative factors like cost savings and revenue.
To learn more about measuring the ROI of Improvement, download this free eBook.


.svg)


Add a Comment