Root cause analysis (RCA) is the practice of digging beneath the surface of a problem to find the systemic reason it occurred -- rather than treating the symptom and moving on. It's one of the most important skills in continuous improvement work, and one of the most commonly done poorly.
The reason it matters is simple: a fix aimed at a symptom is temporary. The same problem comes back, sometimes in a different form, sometimes in the same form a week later. Organizations that get good at root cause analysis stop solving the same problems repeatedly. Organizations that skip it stay stuck in a cycle of firefighting.
RCA is used across industries -- healthcare, manufacturing, software, government, financial services -- and it works within any improvement methodology: Lean, Six Sigma, the Model for Improvement (PDSA), or any structured approach to problem solving.
The Mindset That Makes Root Cause Analysis Work
Before getting into techniques, there's a mindset shift that determines whether RCA produces real results or just generates paperwork.
Most organizations default to asking "who?" when something goes wrong. Who made the error? Who was responsible? Who dropped the ball? This feels productive because it identifies a person, and identifying a person feels like accountability.
But it's not root cause analysis. It's blame.
W. Edwards Deming estimated that over 94% of problems are caused by the system -- the processes, procedures, equipment, training, and working conditions -- not by the individual who happened to be there when something went wrong. "The operator made an error" is almost never a root cause. The real questions are: Why was the error possible? Was the process confusing? Was the training adequate? Was the person fatigued from a poorly designed schedule? Was there a workaround that had become normalized because nobody fixed the underlying issue?
When you address system-level causes, you prevent the error for everyone -- not just the person who triggered it this time. When you blame the individual, you've changed nothing about the system, and the next person in that role will eventually make the same mistake.
This shift -- from individual blame to system analysis -- is the foundation of effective RCA. Without it, every technique described below becomes a ritual that produces reports but doesn't fix anything.
When to Perform a Root Cause Analysis
Not every problem needs a formal RCA. A quick fix for a one-time issue is fine. But structured root cause analysis is warranted when:
- A problem recurs despite previous attempts to fix it
- A safety incident or near-miss occurs
- A quality defect affects customers or patients
- A process consistently fails to meet its target
- The cause isn't obvious from surface-level observation
The recurring-problem signal is the most important one. If your team is solving the same issue for the third time, you haven't found the root cause yet.
Five Root Cause Analysis Techniques
There are dozens of RCA tools. These five are the most widely used in continuous improvement, and each is suited to different types of problems.
1. The 5 Whys
The 5 Whys is the simplest and most accessible RCA technique. Originally developed as part of the Toyota Production System, it works by stating a problem and asking "why?" repeatedly -- typically about five times, though the number varies -- until you reach a cause that, if addressed, would prevent recurrence.
Healthcare example:
- Problem: A patient received the wrong medication dosage.
- Why? The nurse read the order incorrectly.
- Why? The order was handwritten and difficult to read.
- Why? The physician was in a hurry and didn't use the electronic system.
- Why? The electronic system was down for scheduled maintenance.
- Why? Maintenance was scheduled during peak hours without a backup workflow.
The root cause isn't "the nurse made an error." It's that the system allowed a handwritten order to bypass the electronic safeguard because maintenance was scheduled without considering the operational impact. That's a fixable system problem.
Business example:
- Problem: Customer complaints about late shipments increased 40% this quarter.
- Why? Orders are taking longer to process.
- Why? The warehouse team is spending more time searching for inventory.
- Why? Items aren't in their designated locations.
- Why? The restocking process doesn't have a standard method for placement.
- Why? Standard work for restocking was never created.
When to use it: The 5 Whys works best for straightforward problems with a single causal chain. It's quick, requires no special training, and can be done in a team huddle or at a whiteboard.
Limitations: The 5 Whys can oversimplify complex problems that have multiple contributing causes. Different people asking "why?" may follow different chains and reach different conclusions. And untrained practitioners sometimes stop too early (accepting the first plausible answer) or follow the chain in an unproductive direction. For multi-cause problems, pair the 5 Whys with a fishbone diagram.
2. Fishbone Diagrams (Ishikawa / Cause-and-Effect Diagrams)
A fishbone diagram provides a structured way to brainstorm and organize potential causes across categories. The problem goes at the "head" of the fish, and the "bones" represent categories of potential causes. Within each category, the team identifies specific factors that could contribute to the problem.
Common category frameworks:
In manufacturing, the traditional categories are the "6 M's": Man (People), Machine, Method, Material, Measurement, and Environment. In healthcare and service industries, categories might be People, Process, Equipment, Environment, Policies, and Communication.
Example: A hospital team investigating why patient discharge takes longer than four hours might organize their fishbone like this:
- People: Insufficient staffing during peak discharge hours; attending physician unavailable for sign-off
- Process: Pharmacy verification adds 90-minute delay; transport request system requires redundant steps
- Equipment: Only two wheelchairs available for the unit
- Environment: Discharge paperwork must be printed at a station two floors away
- Policies: Insurance verification required before discharge even when pre-authorized
The fishbone's strength is that it forces teams to consider multiple categories of causes rather than jumping to the first plausible explanation. Most problems have contributing factors in several categories, and a fishbone makes that visible.
When to use it: Complex problems where the cause isn't obvious and multiple factors may be contributing. Fishbone diagrams work well as a team exercise because they surface different perspectives.
Limitations: A fishbone identifies possible causes but doesn't by itself tell you which ones are most significant. It generates hypotheses that still need to be verified with data. Pair it with Pareto analysis or direct observation to prioritize.
3. Pareto Analysis
Pareto analysis applies the 80/20 principle to problem solving: typically, a small number of causes account for the majority of problems. By collecting data on defect types, error categories, or complaint reasons and charting them in order of frequency, you can focus improvement efforts where they'll have the most impact.
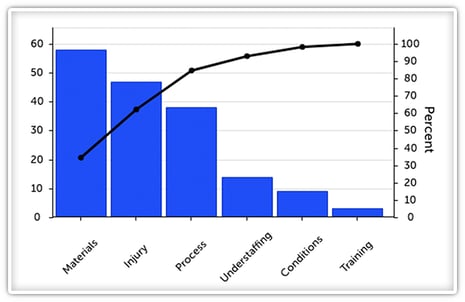
Example: A manufacturing plant tracks the reasons for quality rejections over 90 days and finds:
- Dimensional tolerance issues: 47% of rejections
- Surface finish defects: 23% of rejections
- Material contamination: 12% of rejections
- Assembly errors: 9% of rejections
- Labeling mistakes: 5% of rejections
- Other: 4% of rejections
The Pareto chart makes it obvious: dimensional tolerance and surface finish account for 70% of all rejections. Solving those two categories -- rather than spreading effort across all six -- delivers the most improvement for the least effort.
When to use it: When you have data on problem frequency or impact and need to prioritize which causes to address first. Pareto analysis is especially useful when a team feels overwhelmed by the number of things going wrong -- it cuts through the noise and identifies the vital few.
Limitations: Pareto analysis requires data, which means someone needs to have been tracking problem categories. If you don't have data yet, start collecting it. Even two weeks of structured tracking can produce a useful Pareto chart.
4. Change Analysis
Change analysis is useful when a process that previously worked well has started producing problems. The core question is: what changed?
The technique involves systematically comparing the current state (where the problem exists) to a previous state (where it didn't), looking for differences across categories like personnel, equipment, materials, procedures, environment, and workload.
Example: A call center that historically resolved 85% of inquiries on the first call sees the rate drop to 68% over two months. Change analysis reveals:
- Three experienced agents left and were replaced by new hires (personnel change)
- A new CRM system was rolled out six weeks ago (equipment/systems change)
- No change in call volume, scripts, or policies
The root cause is likely the intersection of two changes: new agents learning a new system simultaneously, with insufficient training on either. The fix isn't to blame the new hires -- it's to redesign the onboarding process to account for the system transition.
When to use it: Problems that emerge after a known or suspected change in the process, personnel, equipment, or environment. Change analysis is fast and intuitive when you can identify a clear "before" and "after."
Limitations: Not all root causes are triggered by a discrete change. Some problems build gradually (equipment wear, cultural drift, accumulating workarounds) and don't show up in a before/after comparison.
5. Failure Mode and Effects Analysis (FMEA)
FMEA is a proactive technique -- unlike the others on this list, it's designed to identify potential failures before they happen rather than investigating ones that already occurred. The team maps each step of a process, identifies what could go wrong at each step, assesses the severity, likelihood, and detectability of each failure mode, and prioritizes which risks to address.
Each potential failure is scored on three dimensions (typically 1-10):
- Severity: How bad is the impact if this failure occurs?
- Occurrence: How likely is this failure to happen?
- Detection: How likely are we to catch it before it reaches the customer?
The three scores are multiplied to produce a Risk Priority Number (RPN). Higher RPNs get addressed first.
When to use it: New processes being designed, existing processes being modified, or any situation where preventing failures is more valuable than reacting to them (which is most situations, but especially those involving patient safety, product safety, or high-cost consequences).
Limitations: FMEA is more time-intensive than the other techniques and requires a team with detailed process knowledge. The scoring can also introduce subjectivity -- two teams may score the same failure mode differently. Use it for high-stakes processes where the investment in prevention is clearly justified.
Choosing the Right Technique
Match the technique to the problem:
For a straightforward problem with a likely single cause, start with the 5 Whys. It takes 15 minutes and often gets you to a workable answer.
For a complex problem where multiple factors may be contributing, use a fishbone diagram to map the landscape, then Pareto analysis to prioritize which causes to address first.
For a problem that emerged after something changed, try change analysis first -- it's the fastest path when a clear before/after exists.
For proactive risk reduction on a critical process, invest the time in FMEA before problems occur.
In practice, experienced teams often combine techniques. A fishbone to brainstorm causes, Pareto to prioritize, and 5 Whys to dig into the top causes -- that sequence handles most problems effectively.
What a Real RCA Session Looks Like
The techniques above are most powerful when they're used together in sequence rather than in isolation. Here's what that looks like in practice.
A team responsible for our KaiNexus self-service knowledge base had a problem: customer satisfaction scores were running at 53% positive, well below the 70-85% benchmark for the industry. They'd collected two years of negative feedback surveys, but the data was noisy -- comments ranged from specific complaints to vague frustration to people who'd arrived at the wrong website entirely.
Step 1: Pareto analysis to focus the effort.
The team categorized every negative and neutral survey response by type, then charted them by frequency. The top category was general dissatisfaction (unhelpful for analysis), but the second was a clear, actionable pattern: "I can't find the information I'm looking for." The top four categories accounted for the vast majority of complaints. This narrowed the scope from "everything about the site" to one specific, tractable problem.
Step 2: Structured brainstorming with a cross-functional team.
Using the Pareto-identified focus area, the team assembled people from support engineering and training -- not just the site owner. Starting from the problem statement ("visitors report inability to find the information they're looking for"), they built a root cause tree by asking "why" repeatedly, branching wherever multiple causes existed.
The tree produced two main branches: the information isn't there (content gaps), and it's there but users can't find it (discoverability). Under discoverability, root causes included untagged older articles, inconsistent terminology, navigation that didn't match user mental models, and entry points that landed users in unhelpful locations. The full tree covered dozens of sticky notes across multiple levels.
Step 3: Triage each root cause.
At the bottom of the tree, the team evaluated each root cause: can we address this, or is it outside our control? "Older articles aren't tagged for search" -- actionable. "HubSpot's search algorithm limitations" -- platform constraint, not actionable. This step prevented the team from wasting effort on countermeasures for problems they couldn't actually change.
Step 4: Build countermeasures traced to root causes.
Each actionable root cause became a specific improvement task, with a direct line back to the root cause it addressed. This ensured that every change was connected to the analysis rather than being a solution someone came up with independently.
The cross-functional brainstorming was critical. A single team working alone would have identified some of the root causes but missed others. The training team surfaced terminology inconsistencies. The support engineers identified technical constraints. The breadth of the tree came from the breadth of the perspectives in the room.
Common Root Cause Analysis Mistakes
The hardest part of RCA isn't the technique -- it's the discipline. Teams under pressure want to fix the immediate symptom and move on. Leaders want answers quickly. But cutting RCA short produces the same cycle of recurring problems.
Stopping too soon. The most frequent mistake. The team identifies a plausible cause, proposes a fix, and moves on -- without verifying whether it's actually the root cause. If your "root cause" is something like "human error" or "lack of attention," you haven't gone deep enough.
Accepting the first plausible answer. Related to stopping too soon, but distinct. Teams often converge on the first explanation that makes sense rather than considering alternatives. The 5 Whys helps here, but only if the team is willing to keep pushing past the comfortable answer.
Focusing on blame instead of systems. When RCA becomes a mechanism for assigning fault, people stop participating honestly. The person closest to the incident -- who has the most valuable information -- is the least likely to share it if they think they're being investigated rather than consulted. Psychological safety isn't a nice-to-have in RCA. It's a prerequisite for getting accurate information.
Skipping the follow-through. Finding a root cause is only half the work. The other half is implementing a countermeasure, verifying that it worked, and updating standard work so the fix sticks. Organizations that are good at analysis but weak at follow-through end up with binders full of root cause reports and processes that never actually change. This is where many organizations hit a wall -- the analysis happens, but the countermeasure gets lost in competing priorities, nobody tracks whether it was implemented, and six months later the same problem resurfaces. A system that assigns ownership, tracks implementation, and measures whether the fix actually held is what separates organizations that improve from those that just investigate.
Doing RCA in a conference room instead of at the gemba. Root cause analysis works best when the team goes to where the problem occurs and observes the process directly. Conference-room RCA relies on memory and assumptions, both of which are unreliable. Go see the work. Talk to the people doing it. The process almost always looks different up close than it does in a meeting.
Frequently Asked Questions
What is the difference between root cause analysis and troubleshooting?
Troubleshooting fixes the immediate problem -- it gets things running again. Root cause analysis goes further by identifying why the problem happened so it can be prevented from recurring. Both are valuable, but troubleshooting alone leads to a cycle of fixing the same issues repeatedly.
How long does a root cause analysis take?
It depends on the complexity. A 5 Whys analysis can be completed in 15-30 minutes. A fishbone session with a cross-functional team typically takes 1-2 hours. FMEA for a complex process can take several days spread over a few weeks. The key is matching the depth of analysis to the severity and recurrence of the problem.
Who should be involved in root cause analysis?
The people closest to the problem -- those who do the work and witnessed the issue. Subject matter experts help interpret findings, and a facilitator keeps the analysis on track. Leadership should support the process but not dominate it. The worst RCA sessions are the ones where a senior leader in the room has already decided what the answer is.
Can root cause analysis be used proactively?
Yes. FMEA is specifically designed for proactive use. Teams can also apply RCA thinking to near-misses -- incidents where something almost went wrong but didn't. Near-misses are free data about system vulnerabilities, and organizations that investigate them prevent problems that haven't happened yet.
What's the relationship between root cause analysis and PDSA?
RCA is typically part of the "Plan" phase of a PDSA cycle. You identify the root cause, develop a countermeasure, test it on a small scale (Do), study the results (Study), and decide whether to adopt, adapt, or try something different (Act). RCA without PDSA produces analysis. PDSA without RCA produces solutions aimed at symptoms.
How do you know when you've found the actual root cause?
Two tests: First, if you address this cause, would the problem be prevented from recurring? Second, if you remove this cause from the scenario, would the problem not have occurred? If the answer to both is yes, you're likely at the root cause. If either answer is uncertain, keep digging.


.svg)


Add a Comment