

Recent Posts

Six Strategies for a Successful Rollout with UMass Memorial Health
February 6, 2025Meet Penny Iannelli, SVP and Chief Transformation Officer at UMass Memorial Health, an organization with a network of hospitals and...
How Hilti Achieved a Scalable and Impactful KaiNexus Rollout
January 14, 2025Hilti is a $7B world leader in designing and manufacturing cutting-edge technologies, software, and services for the professional...

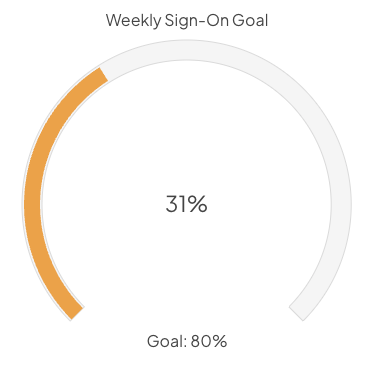
Increasing User Adoption and Engagement
January 7, 2025“What are your best practices for ensuring our users engage with the system?”
This is one of the fundamental questions clients ask. It’s my...
.png)
How Electrolux Revolutionized Its Audit Process with KaiNexus
December 10, 2024The Challenge
As a global leader in appliance manufacturing, Electrolux's commitment to continuous improvement demanded a robust audit...
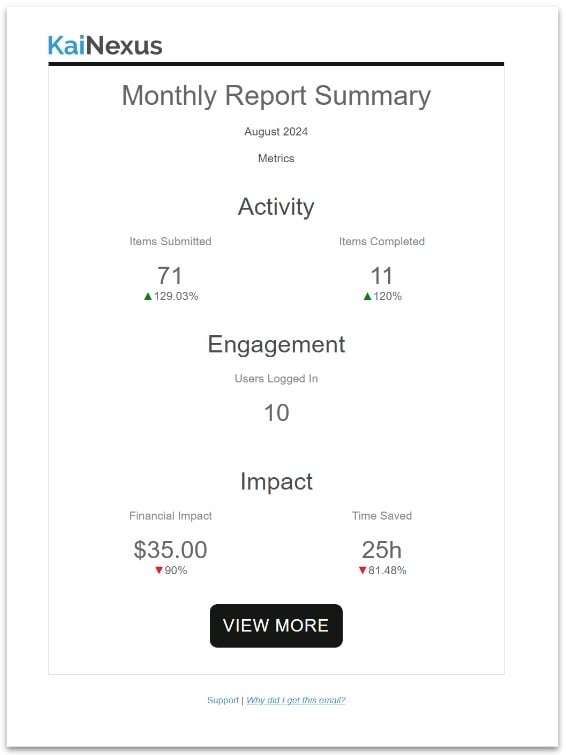
Enhanced Cycle Time Reporting, Additional Item Date Filter Options, and more
January 14, 2025Our latest Release is packed with innovative updates to help your organization achieve more with less effort. This release empowers you to...
.png)
How Tirlán Scaled Strategy Deployment with KaiNexus
March 26, 2026The Challenge
As Tirlán scaled their continuous improvement efforts organization-wide, they found themselves constrained by MS Excel and MS...
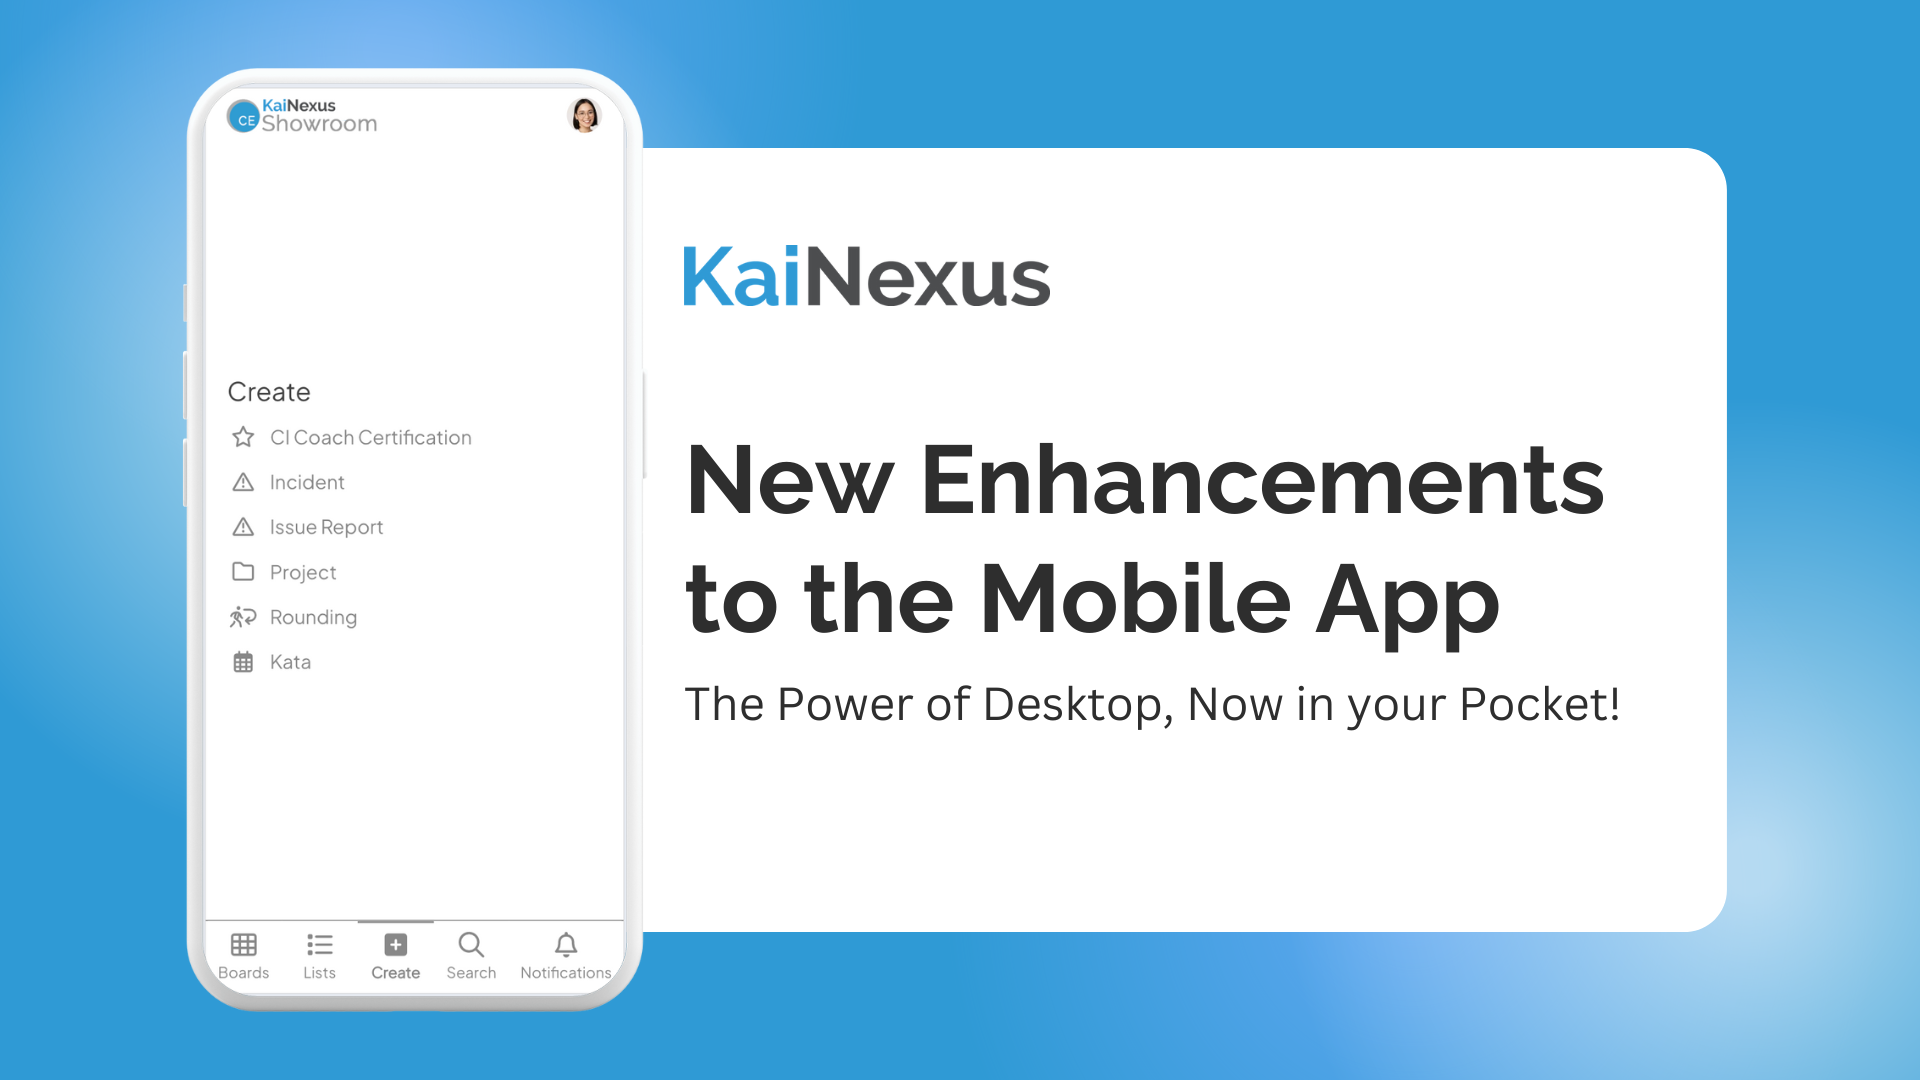
Announcing the Top New Enhancements to the KaiNexus Mobile App
September 23, 2024We have exciting news! The latest KaiNexus release brings a major upgrade to our mobile app. These new mobile enhancements and features...
Mobile App Revamp, Greater Customization on Templates, and more in KaiNexus Release 3.2.2
January 14, 2025We're thrilled to announce our latest update to KaiNexus, which is packed with features designed to streamline your project management...
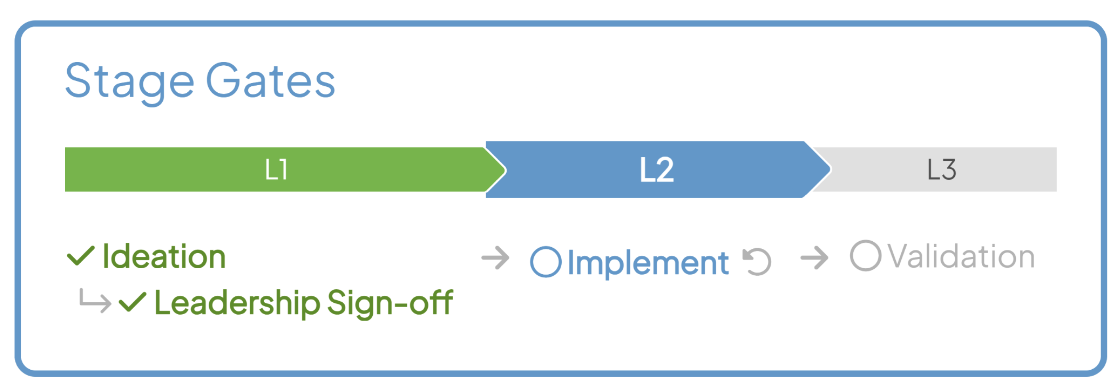
Revolutionizing Milestone Management with KaiNexus' Stage Gates
January 14, 2025Managing complex projects with multiple approval processes can be challenging. Do you wish there was a better way to visualize and track...


.svg)


