 Visual management tools surround us. Although they are so ubiquitous, we might not even think about them. For example, when your car is about to run out of gas, a light will alert you to the problem. Your fitness app may even show you how close you are to your daily goal. Your brain can quickly process these easy-to-understand visual clues and use the information to make decisions.
The Lean business approach takes advantage of this fact and leverages several powerful tools for management and improvement. You don't have to be all in on Lean to take advantage of them. Any organization striving for continuous improvement can benefit.
What Do Visual Management Tools Do?
We'll get into the specifics of some of the most popular Lean visual management tools in a minute, but it is helpful to point out that the purpose of visual tools is to do one or more of the following:
- Share Information with Others
- Streamline Project Management
- Communicate Standard Work Instructions
- Enforce the Standards
- Bring Attention to Irregularities
- React to Irregularities When They Happen
- Prevent Irregularities from Occurring
Lean organizations focus on delivering maximum value to the customer by eliminating waste and creating consistent, predictable results. These practical visual management tools are used to achieve those aims.

Process Control Charts
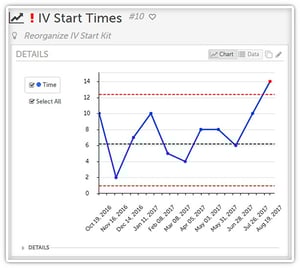
Process control charts (sometimes called "process behavior charts") are graphs or charts that plot out process data or management data (outputs) in a time-ordered sequence. They typically include a centerline, a 3-sigma upper control limit, and a 3-sigma lower control limit. There might be 1- or 2-sigma limits drawn in, as well. The centerline represents the process mean or average (and sometimes the median).
The control limits represent the process variation and help users recognize "common cause" variation, which is expected within the process, and "special cause" variation, which indicates a problem. In addition, trends can be analyzed to determine if the process is stable.
Organizations that practice continuous quality improvement use control charts to provide a common language for talking about process performance and behavior and making informed decisions about which processes to leave alone and which to target for improvement. Along with standard work, control charts limit the need for inspection and determine process capacity based on past performance and trends. They also create the baseline for future improvements and facilitate problem-solving.
Kanban
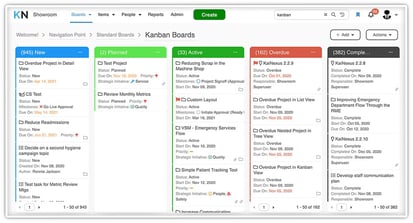 Kanban is a visualization technique designed as part of the Toyota Production System to manage and improve workflow. This approach uses visual cues to balance demand with available capacity and remove system-level bottlenecks. Work items are represented visually to give participants a view of progress and process, from start to finish - usually via a Kanban Managemen board. Work is pulled through the process as capacity permits, rather than work being pushed into the process when requested.
If the workflow is visualized and work in progress is limited, any interruption inflow can be identified, targeted, and resolved before a backlog forms or grows too large. This is important in any industry, as backlogs tie up investment, create prioritization conflicts, and increase the distance to customer value.
Toyota first used the Kanban approach to limit work in progress and minimize inventory using cards to indicate that the stock needed to be replenished. Today, many organizations use digital Kanban boards to represent workflow and reduce friction within processes.
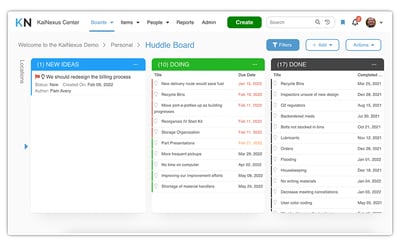
Huddle Boards
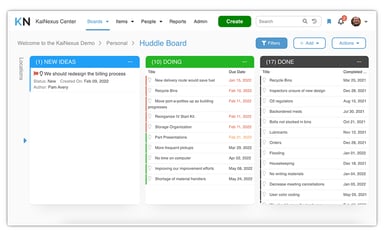 Huddle boards serve the valuable purpose of visualizing the progress of improvement projects. At specified intervals, teams gather to discuss opportunities for positive change and work together to remove any impediments to improvement. Thus, huddle boards visualize work, promote team collaboration, and place a focus on improvement.
Although some organizations use physical huddle boards, the shift to digital visual boards is well underway. New software applications make it possible to get all the visualization and collaboration benefits without the limitations of a physical board hanging on a wall. Cross-functional teams can work on improvement projects even if they are in different locations. The improvement results can be measured over the long haul and communicated to the entire organization, and all improvement work is captured, adding to the repository of tribal knowledge.
Andon Lights
Andon in manufacturing refers to a status-display visualization. The origin of the term Andon is the Japanese word for a traditional paper lantern. An Andon is one of the most common forms of visual management that is in used in Lean. It is a precious tool as it enables the operation to run smoothly without any bottlenecks.
Andon lights are a signal much like traffic lights with three colors on top of each level of the production assembly line. Whenever a worker detects a problem in the production line or finds themself unable to keep pace with the line, they can stop the operation by pulling a cord called 'andon' cord, which sets off an alarm system and illuminates the color-coded andon electric light board.
5S
5S is a work area organization method that uses a list of five Japanese words which have been translated into English as "Sort," "Set In order," "Shine," "Standardize," and "Sustain." The five words that start with S describe how to organize a workspace for efficiency and effectiveness by identifying and storing the items used, maintaining the area and items, and sustaining the new order. 5S is also known as "visual control, visual workplace, or visual factory."
5S often involves color coding, with yellow used primarily for traffic control. Blue, green, or black is used for marketing materials and components, including raw materials, work-in-progress, and finished goods. Orange is often used for materials or products that have been held for inspection, and red is used to mark defects, scrap, rework, and red tag areas.
Value Stream Maps
Value stream mapping is another helpful visual management technique in which all of the activities and raw goods that bring value to the customer are diagramed in a continuous flow. This technique is beneficial for identifying processes that don't add value and targeting them for elimination.

Whether you use one or all of these techniques, adding the element of visual management, especially when assisted by technology, will help you accelerate the pace of improvement, reduce irregularities, and keep everyone engaged.


.svg)


Add a Comment