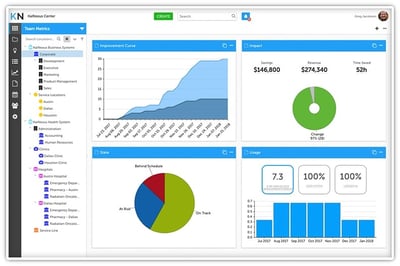
 Lately, we’ve been having lots of conversations with people who have decided that 2019 is the year they will truly embrace visual project management. This is smart. Because of the way the human brain processes information, using charts or graphs to visualize complex data is more natural and more effective than reviewing spreadsheets or reports. Data visualization is a quick way to convey concepts in a manner that can be understood by almost everyone. If you want to get more improvement projects completed this year and gain better insight into how your team is working to cause positive change, then visual project management software is the way to go.
As with any category of technology, not all solutions are the same. We recommend looking for a visual management platform that will support your needs today - as well as those that may become pressing in the future. These applications are pretty sticky once you start using them, so making the right choice in the beginning is critical.
Here are some of the features you can expect from the best solutions.
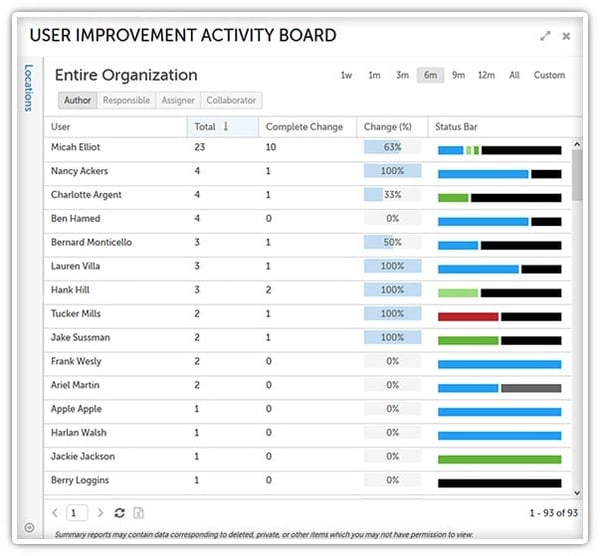
Task Load and Activity Level View
We have found that the organizations who get the most out of visual project management are those that believe that improvement is everyone’s job, that ideas for improvement can come from every employee, and that engagement in improvement is part of how individual success is measured. Therefore, it is important that your project management platform has an easy way to visualize the task load and activity level of each employee. That way, managers can make sure that the load is spread smartly across all team members and that everyone is contributing.
Calendar View
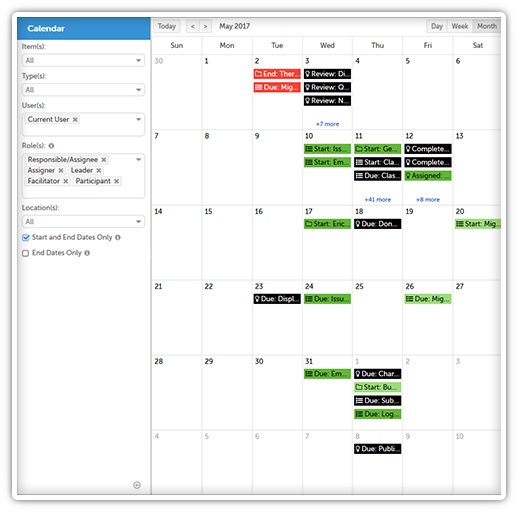
This is a simple, yet essential requirement. Users should be able to see upcoming tasks and meeting in calendar form so that conflicts can be avoided and due dates aren’t missed. Ideally, users can alter the calendar display to show:
- Dates associated with an improvement that the employee has submitted including review and completion dates
- Scheduled Projects
- Assigned tasks
Users should be able to adjust the view to include items by the day, week, or month and they should be able to click on any item to drill down and get more detail.
Kanban View
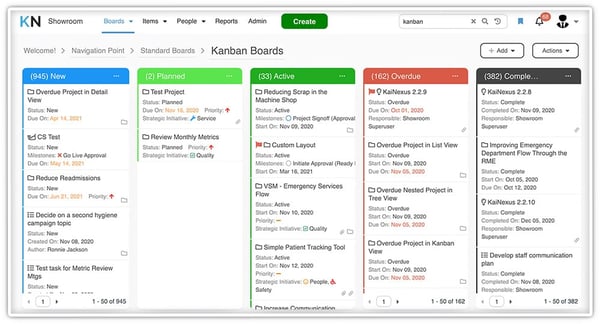
A Kanban board is a visualization tool that helps people understand the flow of their improvement work. Visual project management software with a Kanban View lets you quickly check on your work's progress. The Kanban View breaks down a list of items by status - each column contains all the relevant items of a particular state. For example, columns might be titled, “Planned,” “In Progress,” “Overdue,” and “Complete.
Team Dashboards
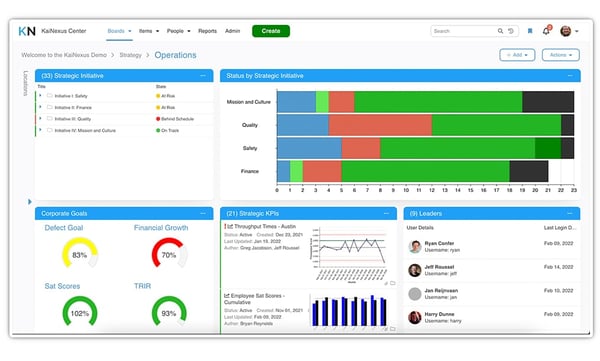
Improvement is a team sport, so your visual project management solution should have configurable dashboards that display tasks and activities related to any given “team.” A team may consist of people who are in the same functional area that regularly work together and are managed by the same person, or it may be made up of a cross-functional group that is working on a particular project or group of initiatives. Either way, each member should have a simple way to keep track of the progress of each element of the improvement.
X-Matrix
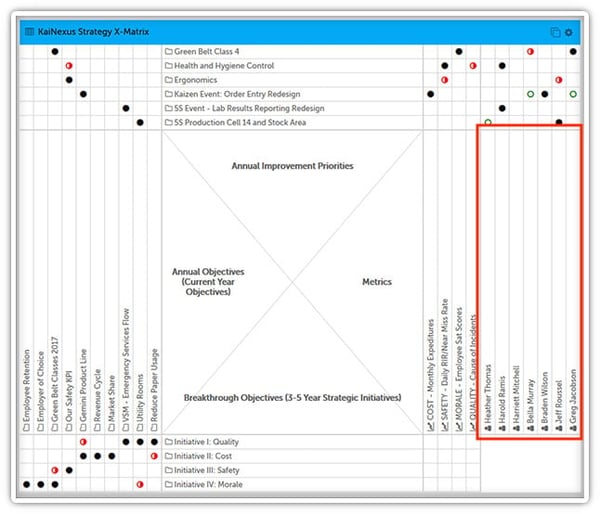
Many organizations utilizing a formal strategy deployment approach use a visualization called an "X-Matrix" to develop and help implement tactical and strategic plans, so they are coordinated across people throughout the organization.
X-Matrices help to ensure ownership and accountability at every level while allowing for faster course corrections when needed. Even if your organization is not utilizing an X-matrix today, it is a good idea to look for this feature so you are prepared if it is deployed in the future.
Huddle Boards
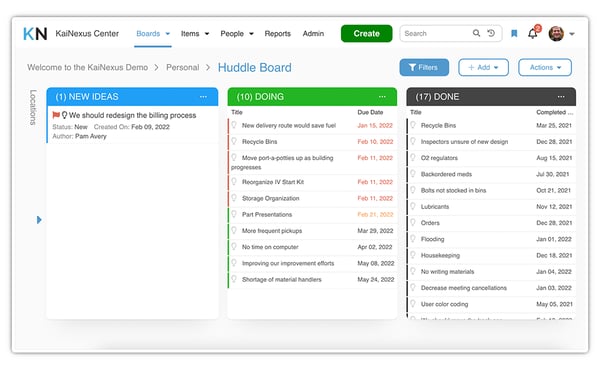
The practice of a Daily Huddle meeting is widespread among organizations dedicated to continuous improvement. The team gathers around a wallboard or poster to discuss newly proposed, active, and recently completed projects. Visual management software that includes huddle boards makes it possible to include people who are not present in the workspace in these meetings and to increase their effectiveness by allowing users to see the board and drill down into any element for more information. The huddle board can be accessed on mobile devices or PCs and can even be displayed on large monitors in the form of a wallboard.
Visual project management does not look the same for every organization. You may find that some of these features are used by your team every day and others require less frequent attention. Smart software buyers give their teams flexibility and help future-proof the solution by choosing a platform with many options for displaying, analyzing, and charting data. If you select one with all of these features, you can expect improved results and a grateful team.


Add a Comment