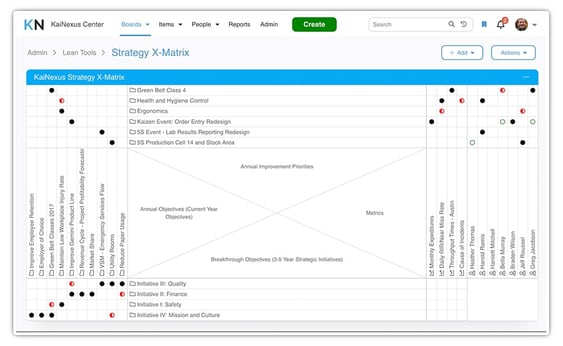
 Many organizations utilizing a formal Strategy Deployment or Hoshin Kanri methodology make use of what's called an "X-Matrix" to develop, visualize, and help implement tactical and strategic plans so they are coordinated across people throughout the organization.
X-Matrices help to ensure that there’s ownership and accountability at every level while enabling cross-functional collaboration and breaking down silos, promoting organizational learning, and allowing for faster course corrections, when needed.
So where does the value in the X-Matrix lie?
In the interaction between the sections!
We use symbols in the intersection between items listed in each of the below sections to signify a relationship. Typically, different symbols are used to represent the different strengths of the relationships.
There are 5 sections on an X-Matrix:
Breakthrough Objectives (Bottom Quadrant)
Lean practitioners typically have long-term goals in place for their improvement efforts. This quadrant enforces that practice by hosting the objectives that are three to five years out. You should only have a few of them.
Annual Objectives (Left Quadrant)
This quadrant hosts short-term goals. These goals should all align with a breakthrough objective. The alignment between annual objectives and breakthrough objectives should be indicated at the appropriate intersection.
Annual Improvement Opportunities and Priorities (Top Quadrant)
Here, the specific annual, short-term opportunities for improvement should be listed.Each of the opportunities for improvement should align with an annual objective, and that alignment should again be indicated at the applicable junctions.
Metrics to measure, Targets to Improve - (Right Quadrant)
The specific metrics that will be used to measure each of the short-term initiatives should be recorded here.That relationship should be noted at the relevant intersection.
Teams and Ownership (Far Right Side)
In this section, make sure that the names of the people responsible for each metric, project, and objective are listed. Signify each person’s relationship to each other section with a mark at the correct junction.
The KaiNexus X-Matrix Add-On
Let me start this explanation by saying that we know that not everyone uses X-Matrices. As such, we don’t want to clutter your system with a tool you might never use, so the X-Matrix feature is disabled by default. But if this post has convinced you to give X-Matrices a try, reach out to your Customer Experience Lead to turn on the X-Matrix Add-On!
With the X-Matrix Add-On:
- You can create a new “X-Matrix Administrator” permission. You’ll want to give the person or people responsible for creating and maintaining X-Matrices a Role containing this permission.
- You’ll be able to work with your Customer Experience Lead to set up various Attribute Types that you can use to signify relationships on your X-Matrices.
Once your Customer Experience Lead sets up these Attributes Types as the X-Matrix correlation Attributes, your organization’s Quality Administrators will be able to maintain them - just as they would any other Attributes. - X-Matrix Administrators will be able to add X-Matrix Cards to their Boards
They’ll be able to configure every aspect of the X-Matrices: the name of the X-Matrix, which Attribute Type should be used to signify relationships, the titles of each quadrant, and, optionally, the headers that should be displayed over or below each column segment. - Once an X-Matrix is added to a Board, the X-Matrix Administrators will be able to add the appropriate markers to signify a relationship between two values.
Have you found X-Matrices to be a useful tool? Have you started adding yours to KaiNexus?
KaiNexus empowers leading organizations in every industry to start, spread and sustain their improvement cultures.
Wherever you are in your improvement journey, KaiNexus will help you take it to the next level with unprecedented visibility, communication, and standardization.


Add a Comment