 As I prepared to write this post, I did a Google Search of, “Visual Management Software,” just to see what popped up. The top 4 posts were about visual project management software. So, it’s not surprising that lots of folks think that’s all there is to visual management technology. Project management software is something that executives will often approve for other people to use, but not something they get excited about for their own use.
But visual management is much more than just project management. Ideally, the entire organization would be managed visually. Why? Because, when presented with information visually, people are significantly more likely to understand and retain it than if the information is presented in other ways. Visual management makes it easier to identify problems and interruptions in a workflow or process. Visual control is a powerful tool for continuous improvement. It makes it easier to engage workers, gives leaders critical insight into operations, and helps to ensure results come in as expected.
We’re not talking about a simple task manager app; we’re talking about using visual management software as the dashboard for running the organization. Here are some of the features that the C-suite will love.
Control Charts
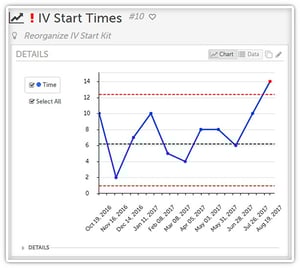 A process control chart also called a process behavior chart, allows users to track how a process performs over time. The graph displays data plotted in time order. It has a central line for the average (or the median), a line that represents the upper control limit, and a line that represent the lower control limit, which are calculated from historical data. (Learn more about how that works in this post and webinar.)
Control charts help executives know when to react to variation and when those variations are within the reasonable expectations of the process. When a concerning deviation occurs, or the trend starts to shift in unexpected ways, leaders can react without delay. Control charts are also useful for determining whether implemented improvements have the expected effect.
X-Matrices
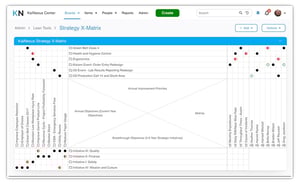 The X-matrix addresses one of the most vital and demanding responsibilities of leaders, strategy deployment. The X-matrix makes the strategy visible. It includes four quadrants (made up by the cross in the X) and one additional section. The lower quadrant holds the breakthrough objectives, the key goals to be achieved over the next three to five years. On the left, you find the annual targets, the shorter-term achievements needed to reach the breakthrough objectives. Annual improvement opportunities and priorities reside in the top quadrant. The right quadrant contains the metrics to measure and the targets to improve. To the right of the X, ownership is assigned. Icons at the intersection of items show how they are related to each other.
The X-matrix is a favorite visual management software feature because it helps to communicate the broader strategy and ensure that priorities are aligned.
Kanban Boards
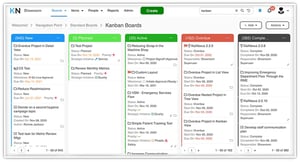 Kanban is a visual approach to tracking the flow of work. A smooth flow is necessary for reducing waste and increasing productivity. In Japanese, Kanban means “visual signal” or “signboard.” The approach was first used in manufacturing but is now prevalent across all industries. A Kanban board displays all work in progress so that leaders can identify interruptions in flow and limit work-in-progress to that which can reasonably make if from one state of completion to the next. Kanban boards are ideal for tracking improvement projects because they make it immediately clear when something in the process is amiss.
With visual management software, executives can create as many Kanban boards as they like so they can react to interruptions whenever they occur.
Huddle Boards
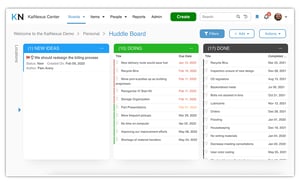 Many organizations use physical huddle boards to organize daily stand up meetings to discuss improvement work. These are usually done on a team by team basis, and each organization may have many huddle boards in use at any given time. Visual management software takes them into the cloud and gives executives access to all of them right from one platform. Why do they care?
While the C-suite might not get involved in the details of every improvement project taken on by a team, they do care very much about the health of improvement culture and the progress toward strategic goals. The ability to quickly glance at or take a deep dive into every huddle board in use gives leaders the ability to quickly access the engagement, activities, and impact of every department or team. They can recognize those who are contributing to positive change and jump in to assist those that seem to be struggling. This reinforces improvement culture and creates a greater connection between leaders and staff.
Visual management software has something to offer everyone. Employees and executives alike can make better decisions, faster, when they have their eyes on the ball.


.svg)


Add a Comment