
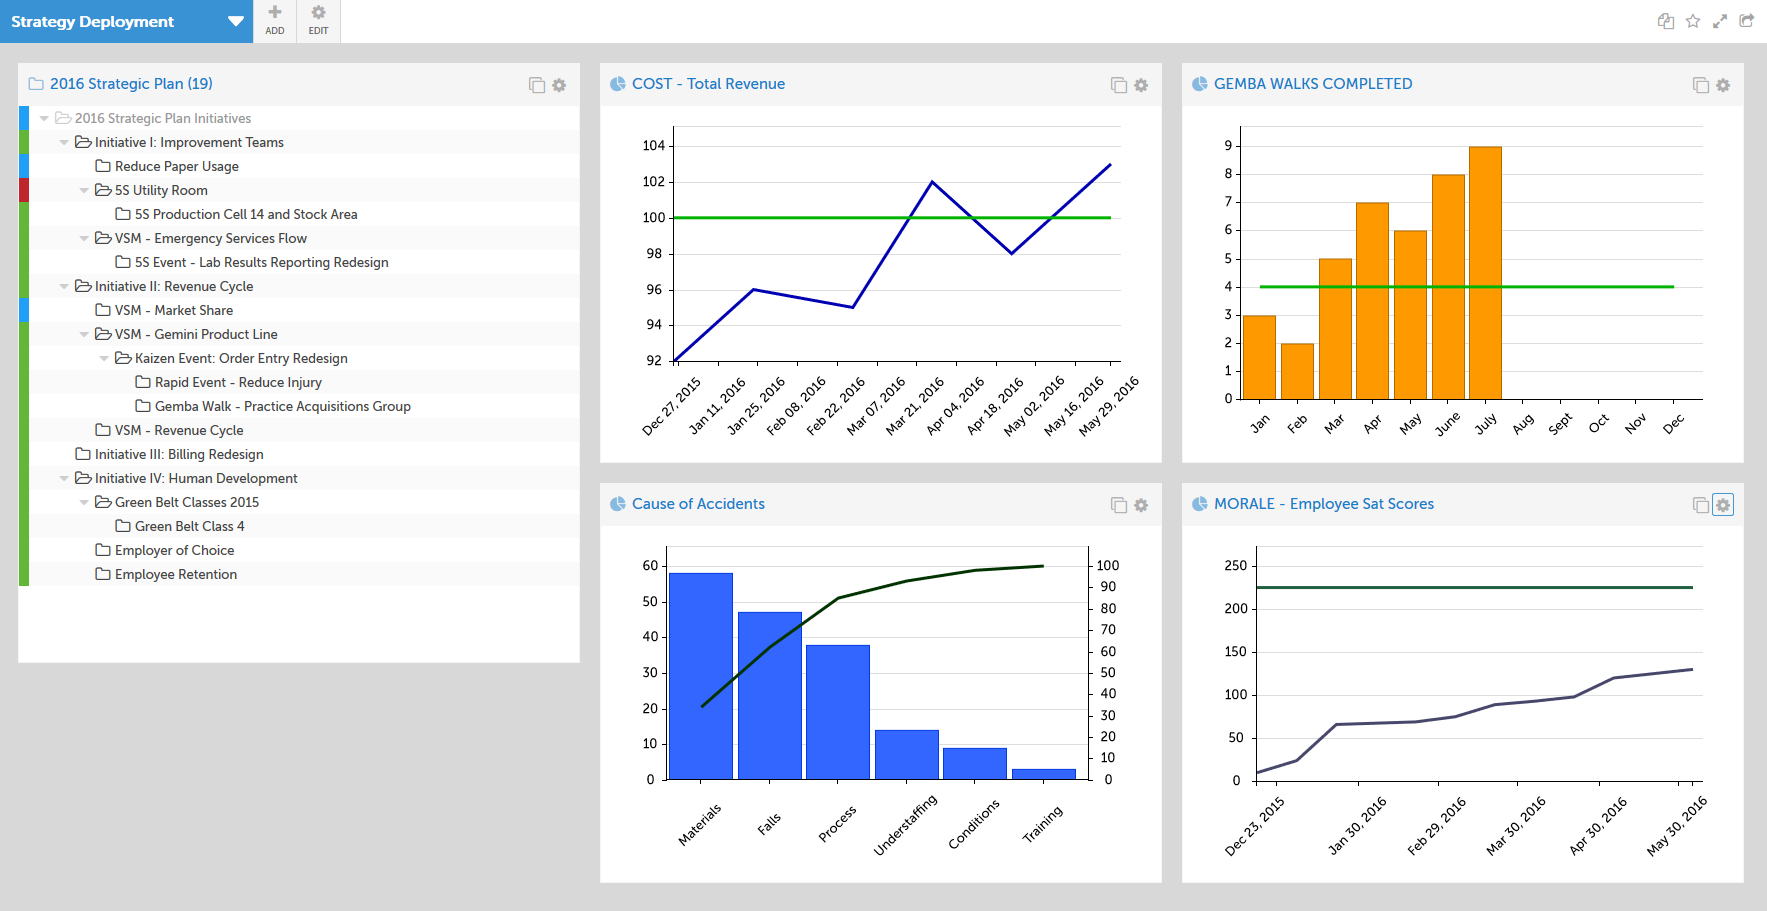
Dashboards: Continuous Improvement at St. Clair Hospital
July 8, 2022Tania Lyon is the Director of Organizational Performance Improvement at St. Clair Hospital in Pittsburgh and a long-time KaiNexus customer....
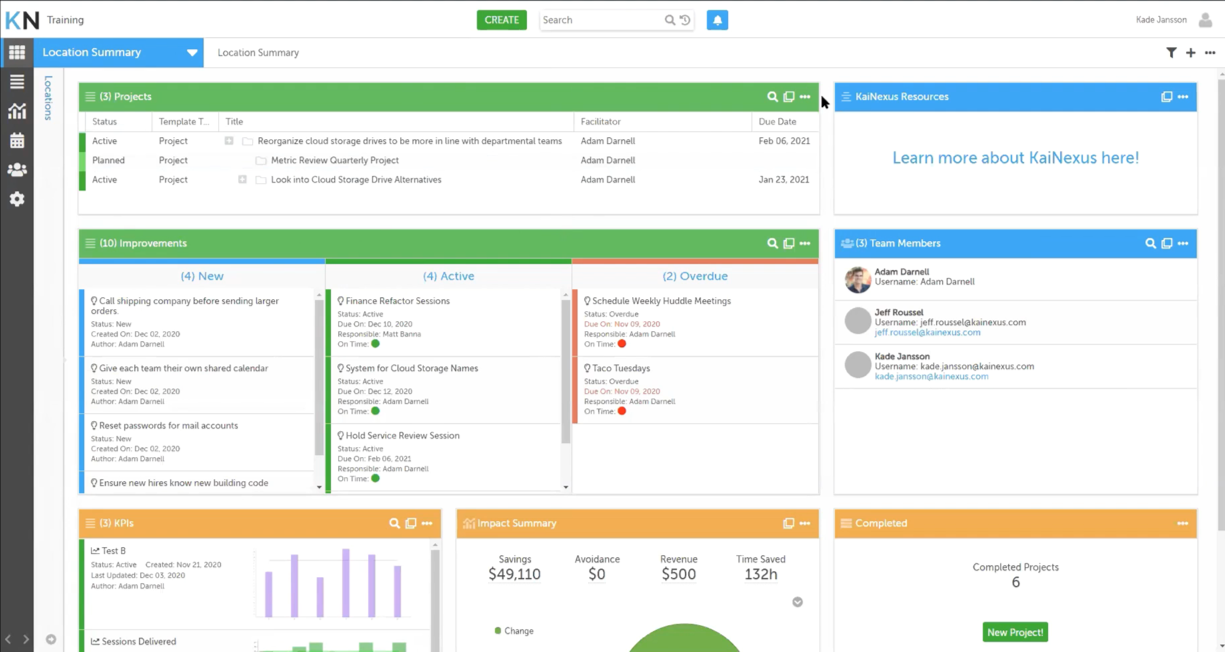
Boards and Best Practices in KaiNexus | Webinar Recap
June 12, 2021During one of our recent KaiNexus Training Team Office Hours webinars, we took a deep dive into Boards in KaiNexus. You can watch it here....
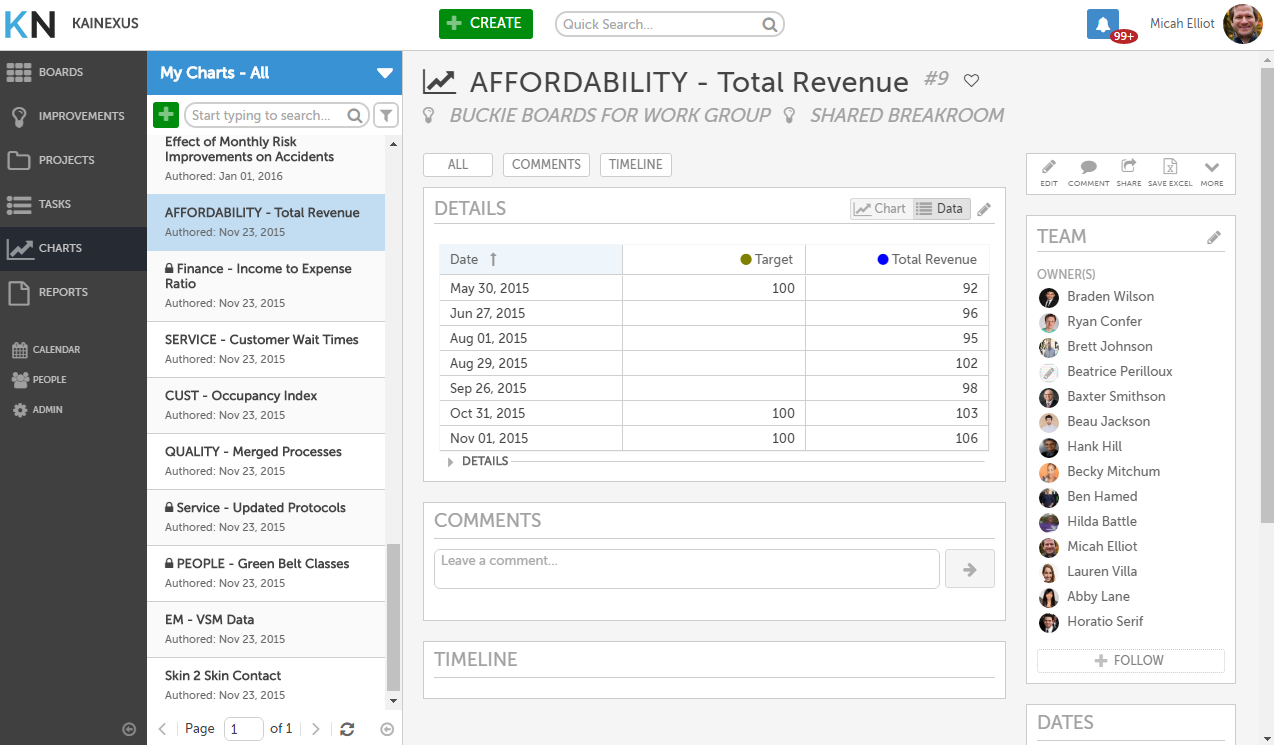
Making Your Improvement Charts Interractive: KaiNexus Charts 2.1
June 2, 2021One of my favorite parts of KaiNexus is the charts feature. Charts let you record all the important data you need to track current...
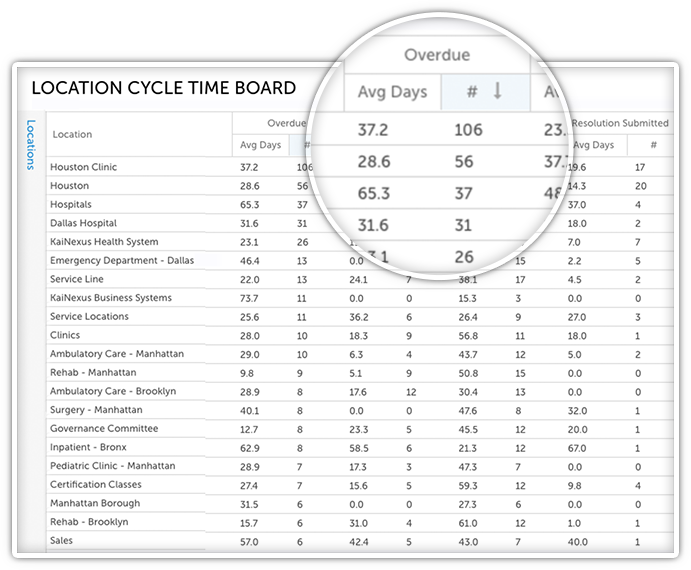
Why You Need to Start Using the New Cycle Time Report
October 6, 2016Cycle time is an important metric to understand because the impact of slower cycle time is often felt on employees’ motivation and their...
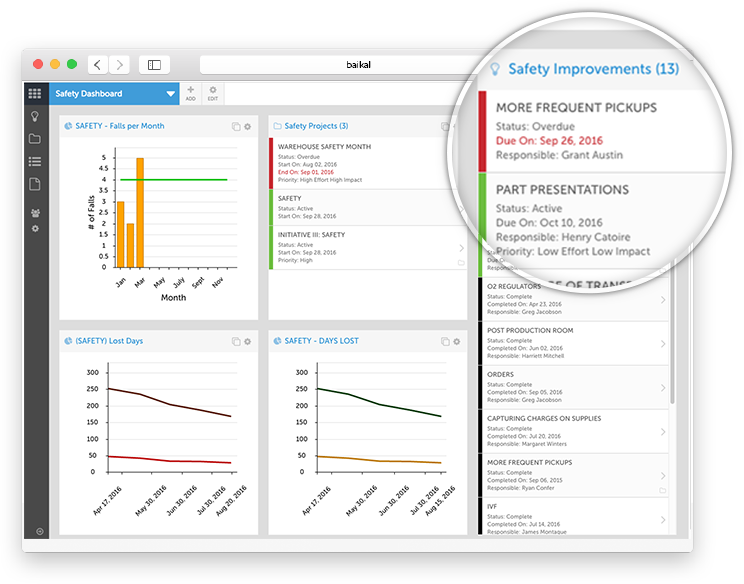
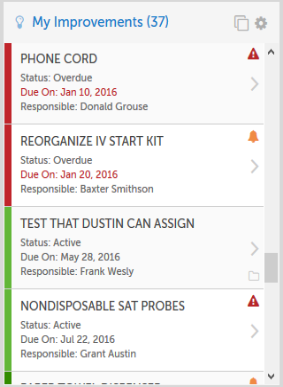
Giving Easier Access to the Improvements People Need to Know About
February 11, 2020If you’ve been using KaiNexus for a while, you’ve probably already discovered the advantages of creating Cards that display Improvements...
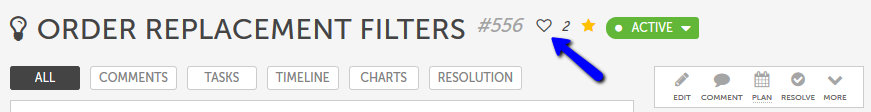
5 Tips and Tricks to Help You Master KaiNexus
September 15, 2016We know that you're all busy, and if our technology is hard to use, no one will want to. That's why we pride ourselves on having such an...
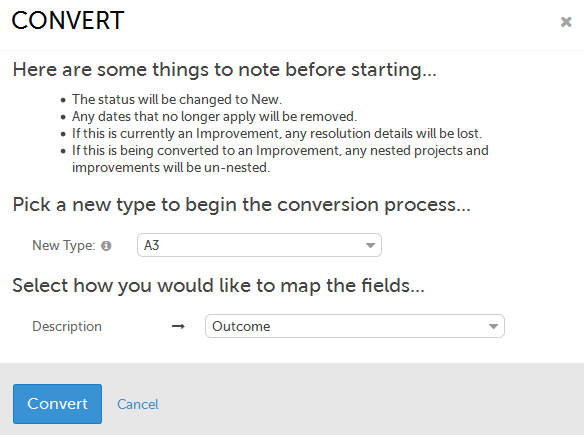
Need to Convert an Improvement into a Project? See How it Works.
September 9, 2016You might have seen this blog post that explained why we devote ridiculous amounts of manpower to talking with our customers. Lots of great...
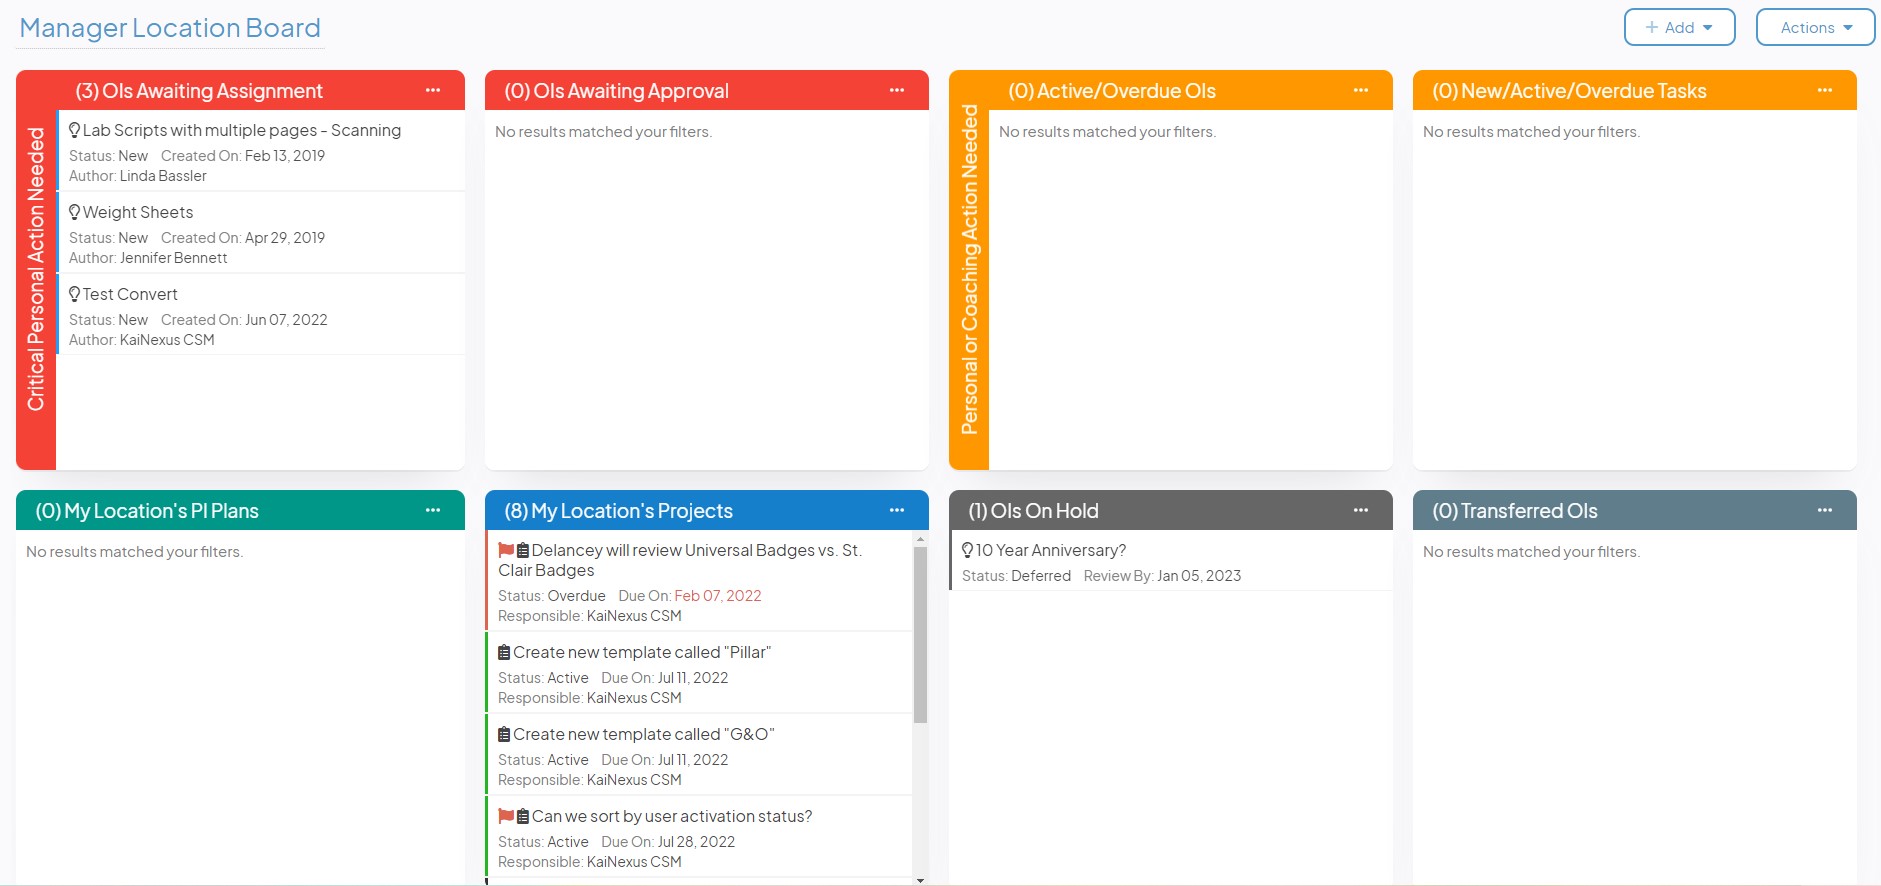
What Boards Should I Be Putting in KaiNexus?
August 25, 2016We’re always talking about how awesome KaiNexus Boards are, but a lot of people don’t realize just how helpful they can be!
These...
Top 6 Most Useful Cards to Include on Your KaiNexus Boards
July 21, 2016Every time you log into KaiNexus, the first thing you see is one of your Boards. Boards are filled with customizable Cards that display...


.svg)


