
Lean Six Sigma combines Lean’s system-wide approach to improving flow and quality with Six Sigma’s analytical tools for understanding variation and strengthening processes. Together, they create a comprehensive framework for operational excellence.
The most effective tools include Value Stream Mapping, 5 Whys analysis, Kanban systems, and statistical process control methods that help organizations eliminate inefficiencies and achieve near-perfect performance.
Building on this foundation, Lean Six Sigma offers practical tools for effective process improvement. In this post, we’ll highlight some of the most widely used techniques and show how they empower teams to deliver measurable, lasting results.
One thing worth noting before we get into the tools: knowing these methods isn't the hard part. Most CI and OpEx teams can rattle off a dozen Lean Six Sigma tools from memory. The challenge is using them consistently across an organization -- making sure fishbone diagrams don't end up in someone's notebook, that Kanban boards stay current, that control plans actually get followed after the project closes. The tools work. The question is whether your organization has the infrastructure to practice them at scale, not just teach them in training.
What is Lean Six Sigma and Why Does It Matter?
Lean Six Sigma is a robust process improvement approach that combines two complementary approaches to enhance operational performance, quality, and efficiency.
Lean Six Sigma is commonly used to improve process flow, quality, reliability, and customer satisfaction across complex organizational systems.
Lean: Lean manufacturing is a management and improvement approach focused on improving flow, building in quality, and enabling continuous improvement across the system. By designing better systems and making problems visible, Lean reduces waste as an outcome rather than a primary goal. Lean organizations often use frameworks such as SQDC—Safety, Quality, Delivery, and Cost—to align improvement efforts with organizational priorities.
Six Sigma: Six Sigma practitioners focus on reducing process variation to improve quality, consistency, and reliability. Six Sigma practitioners use statistical analysis and data-driven methods to understand variation, strengthen processes, and reduce defects that affect customer outcomes.
By integrating these approaches, Lean Six Sigma creates a comprehensive framework that engages everyone in continuous improvement while also leveraging improvement specialists (such as Six Sigma Belts) with advanced analytical and statistical expertise. This combination supports better decision-making, more efficient processes, higher product and service quality, increased customer satisfaction, and sustainable cost reduction.
While Lean and Six Sigma originated in manufacturing, Lean Six Sigma is widely applied across industries, including healthcare, education, software, construction, retail, and service organizations.
What Are the Top Lean Six Sigma Tools Every Organization Should Know?
To decide which Lean Six Sigma processes and tools to include, we considered the tools' widespread adoption and proven track record in achieving results. Here are some of the most popular Lean Six Sigma tools and techniques.
1. Value-Stream Mapping
Purpose: Provides end-to-end process visualization
Value Stream Mapping is a process improvement strategy that cross-functional teams use to create a comprehensive, detailed depiction of the end-to-end process, from the initial customer request to the final product or service delivery. The current state value stream map helps identify bottlenecks, inefficiencies, and opportunities for improved capabilities within the process. A future state value stream map illustrates an improved state to work toward — resulting in improved flow and fewer delays.
2. Cause-and-Effect Analysis (Fishbone Diagram)
Purpose: Systematic root cause identification
Cause and Effect Analysis, often called a Fishbone Diagram or Ishikawa Diagram, is a visual problem-solving tool to explore the root cause of a particular issue, problem, or outcome. The analysis encourages structured brainstorming and systematically investigating contributing factors across different categories, such as people, processes, equipment, environment, and materials. By identifying and organizing the root cause, organizations can gain valuable insights into the underlying reasons behind a problem, facilitating informed decision-making, targeted solutions, and preventing future issues.
In KaiNexus, fishbone diagrams and other root cause analysis tools are built into the improvement workflow -- so the analysis stays connected to the corrective action, the assigned owner, and the measured outcome rather than living in a standalone document that gets filed and forgotten.
3. The 5 Whys Technique
Purpose: Deep-dive problem analysis
The 5 Whys is a problem-solving technique that involves repeatedly asking "why" to delve deeper into the root cause of a problem or issue. It's based on the idea that by iteratively probing the reasons behind a problem, you can uncover its underlying causes rather than just addressing its symptoms. Starting with the initial problem statement, you ask "why" five times or so times to trace the problem back to its source.
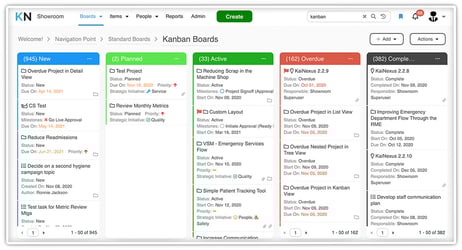
4. Kanban System
Purpose: Visual workflow management
A Kanban system is a supply chain control system to optimize and streamline processes. Kanban relies on visual cues, often as cards or boards, to signal the need for tasks or materials at each process stage. These visual signals help teams understand work in progress, prioritize tasks, and maintain a smooth, efficient workflow while minimizing waste. Kanban emphasizes just-in-time delivery, continuous improvement, and flexibility, allowing Six Sigma teams to adapt quickly to changing demands.
5. Pareto Chart
Purpose: Priority-based problem solving
A Pareto chart is a statistical process tool for prioritizing the significance of factors contributing to a specific problem or situation. It's based on the Pareto Principle, which posits that approximately 80% of effects come from 20% of causes. In a Pareto chart, data is displayed in descending order of importance in a bar graph format, with bars representing different process influences or factors. This visual representation makes it easy to identify the most critical factors contributing to an issue, enabling organizations to focus resources and efforts on addressing the most impactful issues first.
6. Process Mapping
Purpose: Workflow visualization and optimization
Process mapping visually represents a workflow or process. It's a technique that illustrates how different activities, tasks, and steps are interconnected within an organization. Process maps can take various forms, including flowcharts, diagrams, or other representations. They optimize flow and provide a structured overview of a process's functions.
7. Project Charter
Purpose: Project foundation and alignment
A project charter is a foundational project management document that serves as the project's guiding light. It encapsulates the project's purpose, objectives, scope, stakeholders, and high-level plan. This essential document outlines the problem or opportunity being addressed, defines the project's goals and expected outcomes, identifies key stakeholders and their roles, and sets the boundaries for the project's scope.
8. RACI Matrix
Purpose: Role and responsibility clarification
A RACI (Responsibility Assignment) Matrix provides a clear and structured representation of roles and responsibilities within a project or process. It uses the acronym RACI to categorize individuals or roles as:
|
Role |
Definition |
Responsibility Level |
|
Responsible |
Task executor |
Does the work |
|
Accountable |
Decision maker |
Ultimate ownership |
|
Consulted |
Subject matter expert |
Provides input |
|
Informed |
Stakeholder |
Receives update |
9. Failure Modes and Effects Analysis (FMEA)
Purpose: Proactive risk assessment
Failure Modes and Effects Analysis (FMEA) is a systematic and proactive risk assessment methodology widely used in various industries to identify, prioritize, and mitigate potential failures or defects in products, processes, or systems. FMEA helps businesses identify a risk priority number (RPN) for each specified mode, helping teams focus on addressing the most critical issues first.
10. Two-Sample T-Test
Purpose: Statistical comparison between groups
A Two-Sample T-test is a hypothesis test to determine whether a significant difference exists between the means of two independent groups or samples from a population. The test calculates a T-statistic, representing the difference in means relative to the variability within each sample. Researchers can infer whether the observed difference is statistically significant by comparing this T-statistic to a critical value from the T-distribution or by calculating a p-value. This test is valuable in various fields, including scientific research, business, and healthcare, for comparing two groups and drawing conclusions about their population.
11. Mood's Median Analysis
Purpose: Robust central tendency measurement
Mood's Median is a measure used to determine the median value in a dataset when dealing with data that might contain outliers or extreme values that could skew the traditional median. Unlike the standard median, which is the middle value when data is sorted in ascending order, Mood's Median is more robust and resistant to extreme values.
12. Simple Linear Regression
Purpose: Relationship modeling and prediction
Simple Linear Regression is used during the DMAIC analysis phase to model and understand the relationship between two continuous variables: a dependent variable (the one you want to predict or explain) and an independent variable (the one used to make predictions). The goal is to find the best-fitting straight line representing the two variables' linear association. Simple Linear Regression helps quantify the strength and direction of the relationship between the variables, making it valuable for making predictions, identifying trends, and understanding how changes in the independent variable affect the dependent variable.
13. Regression Analysis
Purpose: Multi-variable relationship quantification
The regression analysis technique is used to quantify the relationship between one or more independent variables and a dependent variable. Its primary objective is to understand how changes in the independent variables can predict or explain variations in the dependent variable, identify patterns, and assess the strength and significance of these relationships. Regression analysis is applied across various fields, including economics, finance, healthcare, and social sciences, to gain insights into cause-and-effect relationships, forecast future outcomes, and make informed decisions based on data-driven evidence.
14. Control Plan
Purpose: Sustained improvement maintenance
A Control Plan in Lean Six Sigma is a structured document that outlines the methods and procedures for sustaining process improvements and ensuring ongoing quality control. It's a critical component of the DMAIC process (Define, Measure, Analyze, Improve, Control) methodology, typically implemented during the "Control" phase. Often managed in DMAIC software, the Control Plan is a roadmap for maintaining process stability and preventing the reoccurrence of defects, ensuring that the organization meets quality standards.
In practice, Control Plans are where many DMAIC projects quietly fail. The team does strong work through Define, Measure, Analyze, and Improve -- then the Control Plan gets documented, filed, and never revisited. The process drifts back to its previous state within months. Sustaining the gains requires a system that tracks whether controls are actually being followed, alerts leaders when metrics drift, and keeps the improvement visible long after the project team has moved on. KaiNexus embeds control and sustainment tracking into the improvement lifecycle so that the "C" in DMAIC isn't an afterthought.
15. The 5S System
The 5S System is a workplace organization methodology to optimize the work environment to enhance efficiency, productivity, and safety. "5S" stands for:
|
Phase |
Japanese Term |
English Translation |
Objective |
|
1 |
Seiri |
Sort |
Remove unnecessary items |
|
2 |
Seiton |
Set in Order |
Organize remaining items |
|
3 |
Seiso |
Shine |
Clean and maintain workspace |
|
4 |
Seiketsu |
Standardize |
Create consistent procedures |
|
5 |
Shitsuke |
Sustain |
Maintain improvements long-term |
16. Kaizen (Continuous Improvement)
Purpose: Incremental, ongoing enhancement
Kaizen is a Japanese term that translates to "continuous improvement" or "change for the better." In a business context, it represents a philosophy and methodology focused on making incremental, ongoing improvements to processes, products, and operations. Kaizen emphasizes a bottom-up approach, encouraging employees at every level of an organization to actively participate in identifying inefficiencies, reducing waste, and implementing small, manageable changes.
17. Poka-Yoke (Mistake Proofing)
Purpose: Error prevention and detection
Poka-yoke is a Japanese term that means "error-proofing" or "mistake-proofing." In a manufacturing process context, it refers to designing systems, tools, or processes to prevent or detect errors at the earliest possible stage, eliminating weak points and reducing the likelihood of defects or mistakes.
18. IMR Control Chart
Purpose: Process stability monitoring
An Individual-Moving-Range (IMR) Control Chart is a valuable statistical tool for quality control and process improvement. It consists of two components: the individual data points (values) and the moving range, which calculates the variation between consecutive data points. IMR charts are primarily employed when dealing with continuous data collected over time, allowing practitioners to monitor and assess process stability and variation. These control charts help identify shifts or trends in data and unusual patterns or outliers, which can indicate potential issues or opportunities for improvement in a process.
How Do You Choose the Right Lean Six Sigma Tools for Your Organization?
Selection Criteria Framework
Choosing Lean Six Sigma tools should begin with understanding the problem, not selecting a methodology.
In practice, teams often use Lean principles and visual problem-solving methods to make issues visible and improve flow, while applying Six Sigma’s statistical tools when deeper analysis of variation is needed. The goal is learning and improvement—not tool compliance.
Start with the problem and the system, not the label:
- Where is the problem showing up—flow, delays, defects, safety, or frustration?
- What do people closest to the work see and experience?
- How much variation is present, and do we need data to understand it better?
- What level of analysis is appropriate right now?
- What will help the team learn and improve most quickly?
Implementation Readiness Factors:
- Team expertise: Available skills and training needs
- Resource allocation: Time, budget, and personnel
- Organizational culture: Change readiness and support
- Technology infrastructure: Data collection and analysis capabilities
Tools Are Only as Good as the System That Supports Them
Lean Six Sigma tools are well-documented, widely taught, and available to any organization that wants them. The tools themselves are not the bottleneck. What separates organizations that get sustained results from those that plateau after a few projects is infrastructure: a system that connects problem identification to root cause analysis to corrective action to impact measurement -- and keeps the work visible to leadership throughout.
When fishbone diagrams live in PowerPoints, Kanban boards go stale, and control plans gather dust, the issue isn't that people don't know the tools. It's that nothing ties the tools together into a managed workflow.
KaiNexus provides that infrastructure -- a single platform where improvement work is captured, tracked through structured problem-solving workflows, measured for impact, and sustained beyond the initial project. If your teams know the tools but struggle to apply them consistently at scale, it's worth seeing how the platform works. [See KaiNexus in Action →]
Frequently Asked Questions (FAQ)
What's the difference between Lean and Six Sigma?
Lean and Six Sigma are complementary approaches. Lean focuses on improving flow, building in quality, and enabling continuous improvement across the system, while Six Sigma applies statistical analysis to understand variation and strengthen processes. Lean Six Sigma combines both to support sustainable, data-informed improvement.
What industries benefit most from Lean Six Sigma?
While originally developed for manufacturing, Lean Six Sigma has proven effective across industries, including healthcare, finance, retail, education, and service sectors.
Do I need special certification to use Lean Six Sigma tools?
While certification (Yellow Belt, Green Belt, Black Belt) is beneficial, many basic tools can be implemented without formal certification. However, complex statistical tools require proper training and coaching by more experienced Belts or leaders.
How do I sustain improvements after initial implementation?
Sustainability is the most common failure point in Lean Six Sigma. It requires active monitoring -- not just a documented Control Plan, but a system that tracks whether controls are being followed and alerts leaders when performance drifts. Leadership commitment means regularly reviewing improvement data, not just approving projects at the charter stage. Organizations that sustain gains consistently use a platform that keeps completed improvements visible, tracks ongoing control metrics, and makes it easy to reopen work when conditions change.
Can small businesses implement Lean Six Sigma effectively?
Yes, small businesses can start with simpler tools like 5S, Kaizen, and basic process mapping before advancing to more complex statistical methods.
What's the biggest challenge in Lean Six Sigma implementation?
Cultural resistance to change is often the primary challenge. Success requires strong leadership support, employee engagement, and consistent communication about benefits and progress.


.svg)


Add a Comment